


Most pool service owners don't buy trucks on a plan. They buy them on a feeling. Summer gets crazy, route density tips over, two techs are double-booked on a Tuesday, and suddenly you're at the dealership signing paperwork on a fourth van because "we clearly need it." That truck then stays on the books for eight years whether it's running 180 stops a week or 60, because once a vehicle is parked in your lot it becomes invisible. Nobody questions it. It's just the fleet.
That's the real problem with fleet management in pool service — not the buying decision, but the complete absence of a system that tells you whether each vehicle is pulling its weight month after month. A fleet isn't a collection of trucks. It's a set of rolling cost centers, each with a utilization curve, a cost curve, and a point where those two lines cross and the truck starts losing you money. If you can't see those lines, you're guessing.
This article is about building the system that makes those lines visible: utilization dashboards, replacement TCO (total cost of ownership) models, and an annual budget cadence that ties vehicle decisions back to your actual route design. Done right, it turns fleet from an emotional expense into a planned, boring, predictable line item — which is exactly what you want it to be.
Why fleet decisions drift out of sync with the actual work
The pattern shows up across small operators constantly. The route footprint changes faster than the fleet does. You win a cluster of commercial accounts across town, lose a handful of residential accounts in an old neighborhood, a tech quits and their route gets absorbed by two others — and through all of that churn, the truck count stays frozen. Trucks respond to crises like a breakdown or a new hire, but not to the slow, continuous shift in where and how dense your work actually is.
So you end up with mismatches nobody notices because nobody's measuring them:
-
A truck assigned to a sprawling rural route doing 45 stops a week while burning fuel on 30-minute drives between pools
-
A truck that's technically "full" but spends two hours a day idling in a yard because the tech finishes early three days a week
-
A spare truck kept "just in case" that runs maybe 15 days a year but still eats insurance, registration, and depreciation every single month
None of these are dramatic. That's the issue. A dramatic problem gets fixed. A truck quietly costing you $600 a month in carrying cost while generating almost no revenue just sits there, lumped into a fleet expense category nobody breaks down per-vehicle.
Fleet drift happens because the decision to add capacity and the decision to measure capacity live in two different mental buckets. Owners track revenue per route and maybe cost per stop, but almost nobody tracks cost per truck against revenue per truck. Without that, you can't right-size anything.
What a real utilization dashboard actually measures
"Utilization" gets thrown around loosely. For a service fleet it has to mean something specific, and it's not just "miles driven." A truck can rack up huge mileage and still be badly utilized if most of those miles are deadhead — driving between jobs instead of parked at one.
Eliminate missed appointments and dispatch delays.
Splshly ensures every pool service is scheduled, tracked, and completed efficiently.
- Unified scheduling dashboard
- Automated customer reminders
- Technician route optimization
No credit card required
A useful fleet utilization dashboard for pool service tracks each vehicle on a small set of numbers:
-
Revenue-producing hours vs. total available hours — the share of the workday a truck is actually at a billable stop
-
Stops per day and stops per mile — density, not just activity
-
Deadhead ratio — the percentage of drive time spent between jobs rather than on-site
-
Days active per month — how often the truck leaves the yard at all
-
Cost per revenue mile — total vehicle cost divided by the miles that actually produced income
The deadhead ratio is the one most people miss, and it's often the most revealing. Two trucks can both report "8-hour days," but if one spends 90 minutes driving between stops and the other spends 3 hours, that second truck is doing roughly half the real work for the same cost. That gap is directly tied to how you've drawn your routes, which is why utilization and route design can't be looked at separately.
A truck's numbers are really a verdict on its route. If your batching and territory logic is sloppy, the dashboard will show it as a utilization problem on a vehicle that's actually fine — the route around it is the problem. Tightening territory heuristics usually moves the utilization numbers more than anything you do to the truck itself. It's worth revisiting your route planning rules for mixed residential-commercial territories before blaming the vehicle.
A typical example: an operator with five trucks pulls the numbers for the first time and finds three running at 70–80% revenue-hour utilization, one at about 55%, and the "spare" under 20%. The 55% truck isn't a bad truck — it's a bad route. The spare is a different conversation entirely.
The replacement TCO model nobody builds (but should)
When owners think about replacing a truck, they anchor on the purchase price and the trade-in value. That's the smallest part of the story. Total cost of ownership is everything the truck costs you over its life, spread across the work it does, and it climbs on a curve most people never plot.
The rough shape of it: a truck's depreciation is front-loaded and steep in the early years but flattens out. Meanwhile, maintenance and downtime costs start near zero and climb — slowly at first, then sharply once major components start failing. Somewhere those two curves cross, and shortly after that crossing point the truck becomes more expensive to keep than to replace. The whole point of a TCO model is to find that crossing point before you hit it, not after the third transmission scare.
A simple per-truck TCO breakdown looks like this:
| Cost component | How it behaves over time | Notes for pool fleets |
|---|---|---|
| Depreciation | High early, flattens later | Biggest hidden cost in years 1–3 |
| Fuel | Fairly flat per mile | Spikes with deadhead-heavy routes |
| Scheduled maintenance | Rises steadily | Tied to your PM discipline |
| Unscheduled repairs | Low, then sharp climb | The curve that signals replacement |
| Downtime / swap cost | Jumps as truck ages | Lost stops + emergency rental |
| Insurance & registration | Flat, slow drift | Fixed carrying cost regardless of use |
The column that trips people up is downtime cost. When an older truck breaks down mid-route, the real expense isn't just the repair bill — it's the 12–18 stops that got pushed, the overtime to catch up, and the customers who got a "we'll reschedule" text. A five-year-old truck that breaks down four times a season is quietly costing you far more than its repair invoices suggest, and that cost never shows up in a maintenance ledger. Your preventive maintenance discipline directly shapes this curve, which is why equipment-specific preventive maintenance schedules and replacement triggers feed straight into the TCO model rather than sitting in a separate silo.
The insight here: a TCO model turns replacement from a panic decision into a scheduled one. Once you can see the curves, you replace a truck in the slow season on your terms — not in July when it dies and you're paying a premium for whatever's on the lot.
Building the replacement decision as a repeatable process
A TCO model is only useful if it drives a decision. A practical sequence for running a truck through the replacement question each year:
-
Pull the per-truck utilization numbers for the trailing 12 months — revenue hours, stops, deadhead, active days.
-
Calculate cost per revenue mile by combining all cost components against the miles that produced income.
-
Plot the two-year trend, not just the current snapshot. A truck at $0.90/revenue mile trending up fast is a different decision than one that's been flat at $0.90 for three years.
-
Flag any truck that crossed a utilization or cost threshold — more on thresholds below.
-
Compare keep-vs-replace over a 3-year horizon, including downtime and swap cost, not just the monthly payment math.
-
Slot the decision into the budget cadence so replacements happen in the off-season on purpose.
The step people skip is #3. A single bad year on a truck might be a fluke — a tech who drove it hard, a route that got messy. The trend tells you whether it's a pattern or noise. One expensive quarter isn't a replacement signal. A climbing cost-per-mile line across two years is.
Setting utilization thresholds that actually trigger action
Dashboards without thresholds are just wallpaper. The numbers have to connect to pre-agreed actions, or you'll stare at a low-utilization truck for a year and do nothing because there's no rule that says you must.
-
Utilization under ~40% for two straight quarters → the truck is a candidate for elimination or reassignment, not replacement. You don't replace a truck that isn't being used; you cut it or re-route to fill it.
-
Deadhead ratio above ~35% → this is a route design flag, not a vehicle flag. Fix the route before touching the truck.
-
Cost per revenue mile 25%+ above fleet average → investigate for maintenance pattern or replacement timing.
-
Unscheduled downtime events exceeding 3–4 per season → move the truck up the replacement queue regardless of its age.
-
Active days under 20 per month on a non-spare truck → you have more fleet than route, full stop.
The threshold that saves the most money is the low-utilization one, because it forces the question most owners avoid: do we need this truck at all? Cutting a truck feels like going backward. But a van running at 30% utilization that you eliminate by redistributing its stops across the other routes can drop $7k–$10k a year in carrying cost straight to the bottom line, with zero revenue lost. That's not shrinking — that's right-sizing.
Tying it all to an annual budget cadence
The piece that makes this a system rather than a one-time cleanup is cadence. Fleet decisions should happen on a calendar, in the slow part of your year, when you have time to think and leverage to negotiate. For most northern-hemisphere operators that's late fall through winter. For Australian operators it flips, but the logic is the same: do your fleet planning when the trucks are quietest.
A simple annual rhythm:
-
End of peak season — pull the full year of per-truck utilization and TCO data while the memory of the busy season is fresh.
-
Off-season planning window — run every truck through the replacement decision process, apply thresholds, and flag the keep / cut / replace calls.
-
Pre-season — execute
buy, sell, or re-route before the work ramps. Never make a fleet decision in the middle of your busiest month.
This cadence also has to talk to your staffing and cashflow plan, because a truck and a tech are a matched pair — adding one without the other just creates a different bottleneck. If you're planning capacity for the season anyway, fold the fleet review into the same exercise you use for seasonal capacity and cashflow planning so vehicle, headcount, and cash all move together instead of in separate, conflicting decisions.
Worth internalizing: owners who plan fleet annually spend less on fleet than owners who react, even when they end up with the same number of trucks. The savings come from timing — buying off-season, selling before a truck's cost curve spikes, and never paying emergency premiums for a last-minute replacement in July.
A real scenario: four trucks that should have been three
Consider a mid-sized residential-heavy operator running four trucks and five techs, with one tech floating between vehicles. Revenue was healthy but margin kept slipping and nobody could pin down why. Fuel and labor were in line. The leak was in the fleet, invisible because fleet was one lumped expense line.
When they finally broke costs out per vehicle, the picture was clear fast. Three trucks were running 70%+ utilization. The fourth — the one the floating tech used — was active maybe 14 days a month, under 30% utilization, with a deadhead ratio north of 40% because it only came out for scattered overflow stops. Carrying cost on that truck, all-in, was running close to $650 a month. It was generating almost nothing proportional to that.
The fix wasn't dramatic. They redistributed the overflow stops across the three dense routes by tightening the territory batching, kept the floating tech, and sold the fourth truck in the off-season. No revenue was lost — the stops didn't disappear, they got absorbed into better-designed routes. The result was roughly $7k–$8k a year in carrying cost gone, plus the one-time cash from the sale. Same work, same customers, one fewer rolling cost center. The only thing that changed was that they finally measured per-truck instead of per-fleet.
When right-sizing down is the wrong move
This cuts both ways, and it's worth being honest about it. A low-utilization truck isn't automatically a truck to cut. Sometimes it's genuine surge insurance, and eliminating it bites you the first time two trucks break down in the same week during peak. If your season has sharp spikes — storm cleanup, a heat wave that triggers a flood of green-water calls — a spare truck at 20% utilization might be cheap insurance against the far bigger cost of blowing SLAs when demand explodes.
Operators with high demand variability, operators in storm-prone regions, and anyone whose "spare" is actually their emergency-swap vehicle when a primary goes down mid-route — for them the right answer isn't eliminate. It's account for it honestly. Call that truck what it is: a capacity buffer with a known monthly cost, justified by a specific risk. That's a legitimate line item. What's not legitimate is a 30%-utilization truck that nobody can explain, sitting in the lot out of pure inertia.
The test is simple: can you name the specific reason a low-utilization truck exists? "Storm surge backup" is a reason. "We've always had four" is not.
Where the system tends to break — and how to keep it honest
The hard part of this isn't the math. The math is a spreadsheet. The hard part is getting clean per-truck data without a human babysitting it, and that's where most operators quietly give up. Deadhead ratio, revenue hours, stops per mile — none of that is visible unless your scheduling, routing, and job-completion data all tie back to a specific vehicle. When those systems live in separate tools, reconstructing per-truck numbers at year-end becomes a weekend of manual spreadsheet misery, so it doesn't happen, and the fleet drifts for another year.
This is where an operational platform earns its keep in the background. When your route data, job completions, and vehicle assignments already flow into one system, the utilization dashboard essentially builds itself — each truck's revenue hours, deadhead, and active days roll up automatically instead of being reconstructed by hand. Simple automation can also watch the thresholds for you and flag a truck the moment its cost-per-mile crosses the line, so the review happens on schedule instead of whenever someone remembers to look. The value isn't the dashboard looking nice. It's that the data stays trustworthy enough that you'll actually act on it, year after year, without it becoming a chore you skip.
Pro-tip: configure your dispatch and job-completion workflow to require a vehicle assignment on each job so deadhead and revenue hours are captured automatically.
Below is a simple visualization of that automated workflow.
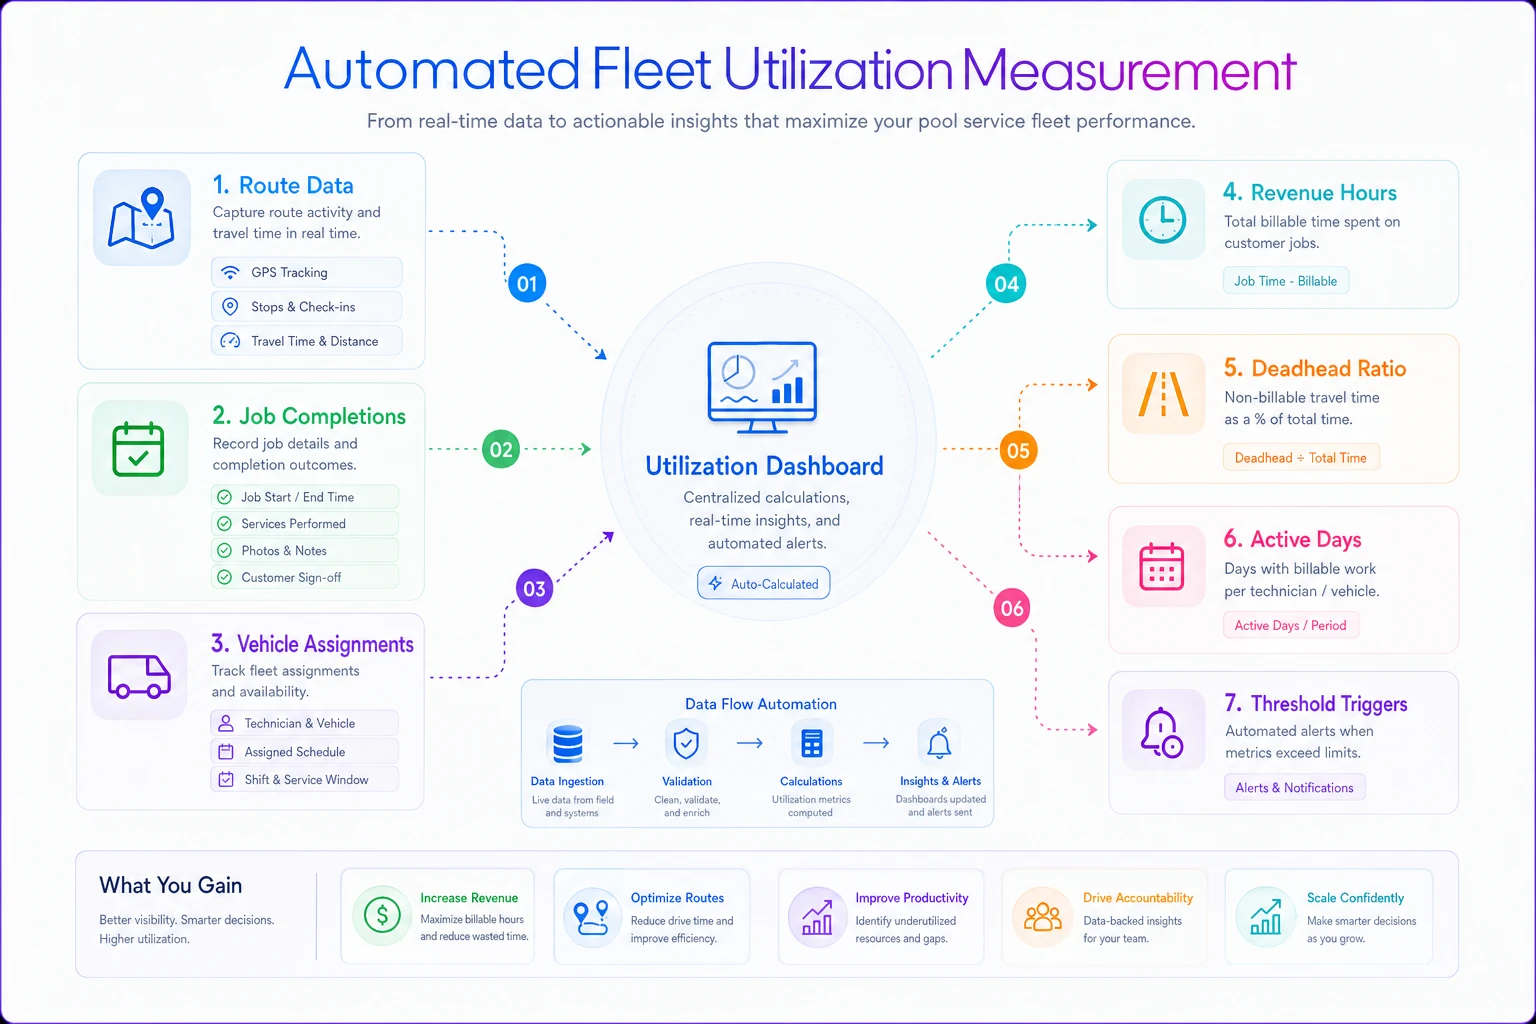
The fleet right-sizes itself when measurement is automatic and thresholds are pre-agreed. Everything else — the TCO curves, the budget cadence, the keep-cut-replace calls — follows naturally once you can finally see each truck as its own little P&L instead of one blurry expense line. Most operators are running at least one truck they'd cut tomorrow if they could see the numbers. The only real task is making those numbers impossible to ignore.
The only real task is making those numbers impossible to ignore.
Ready to elevate your pool service business?
Join hundreds of pool service professionals using Splshly to save time, optimize routes, and enhance customer satisfaction.