
Most pool service companies handle equipment maintenance like they're checking oil—same intervals, same checklist, regardless of actual condition. After working with equipment across different environments and usage patterns, the gap between early failures and extended lifespans comes down to lifecycle-based maintenance that tracks real component wear.
A variable-speed pump in a backyard pool running 8 hours daily ages differently than the same pump at a community center running 16 hours. Most companies use identical maintenance schedules for both. The residential pump might need bearing inspection at 18 months, while the commercial one shows wear at 9 months. Miss those early indicators, and you're dealing with catastrophic failures instead of planned replacements.
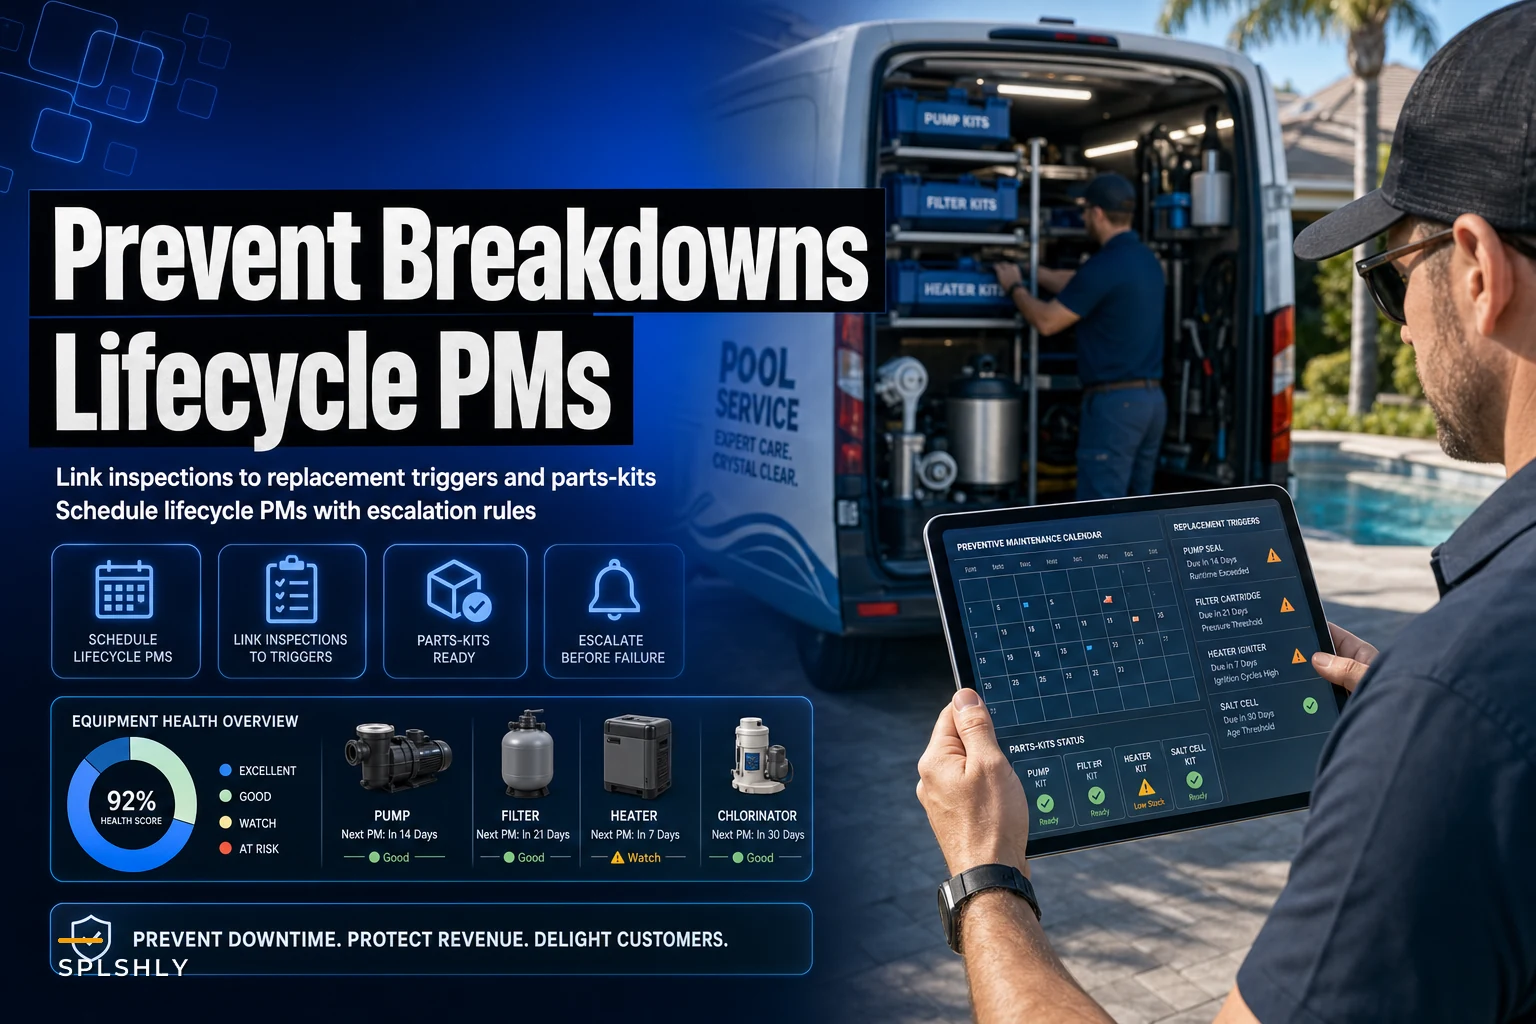
The challenge isn't just different maintenance intervals—it's connecting inspection results to replacement triggers, maintaining parts for predictable failures, and escalating decisions when equipment hits end-of-life. Generic checklists can't handle this complexity.
Why standard PM schedules fail pool equipment
Pool equipment fails in predictable patterns, but those patterns shift based on water chemistry history, runtime hours, and environmental factors. A pump seal kit might last 3 years in balanced water but fail in 14 months with chronic high calcium. A heater exchanger in coastal salt air corrodes twice as fast as one inland.
When you're managing hundreds of pools with different equipment ages and histories, this gets complicated fast. That 2014 Pentair pump at the Johnson property has had two seal replacements and shows bearing wear. The identical model installed last year at the Miller house runs perfectly. Same maintenance schedule for both means you'll either over-service the newer unit or under-maintain the older one.
Traditional preventive maintenance treats equipment the same age equally. But degradation happens from cumulative stress, not calendar time. A filter backwashing weekly due to heavy bather load wears laterals faster than one backwashing monthly. Without tracking usage patterns and connecting them to maintenance triggers, you're guessing when components need attention.
Building lifecycle-aware maintenance protocols
Pool equipment preventive maintenance starts with understanding each component's failure modes and degradation curves. Pumps don't just "fail"—they progress from seal weepage to bearing noise to complete seizure. Each stage has inspection checkpoints and intervention opportunities.
Eliminate missed appointments and dispatch delays.
Splshly ensures every pool service is scheduled, tracked, and completed efficiently.
- Unified scheduling dashboard
- Automated customer reminders
- Technician route optimization
No credit card required
Sand Filter Lifecycle Protocol:
-
Month 6
Baseline pressure differential check
-
Year 1
Media bed inspection for channeling
-
Year 2
Sand sample for grain degradation
-
Year 3
Deep bed probe for calcification
-
Year 4-5
Replacement evaluation based on backwash frequency
DE Filter Lifecycle Protocol:
-
Every 6 cleanings
Grid stretch measurement
-
Year 1
Manifold seal inspection
-
Year 18 months
Grid fabric integrity check
-
Year 2
Full teardown with individual grid pressure test
-
Year 3
Replacement cost vs rebuild analysis
Cartridge Filter Lifecycle Protocol:
-
Every 3 cleanings
Pleat separation check
-
Month 9
End cap bond inspection
-
Year 1
Flow rate degradation test
-
Year 18 months
Chemical cleaning effectiveness measure
-
Year 2
Core integrity evaluation
These timeframes are based on residential usage patterns of 8-10 hours daily runtime. Commercial pools hit these checkpoints faster. You need to track actual runtime hours and chemical exposure, not just calendar dates.
Inspection checkpoints that actually predict failures
Predictive maintenance requires inspections that measure degradation, not just verify operation. Checking that a pump "works" tells you nothing about how close it is to failure. Measuring shaft play, seal compression, and bearing temperature gives you failure prediction data.
Early Stage (0-18 months):
-
Mechanical seal weepage check (drops per minute)
-
Shaft end play measurement (thousandths of an inch)
-
Voltage/amperage draw compared to nameplate
Mid-Life (18-36 months):
-
Bearing temperature rise over ambient
-
Vibration measurement at mounting points
-
Seal face scoring inspection
-
Impeller wear ring clearance
Late Stage (36+ months):
-
Complete teardown inspection
-
Bearing race condition
-
Volute wear patterns
-
Shaft runout measurement
Each inspection point has thresholds that trigger actions. Shaft play over 0.015" means bearing replacement within 6 months. Seal weepage over 10 drops per minute needs immediate attention. Amperage draw 15% over nameplate indicates motor failure approaching. These aren't random numbers—they're failure predictors validated across thousands of equipment lifecycles.
Heater Inspection Progression:
-
Stack temperature vs water temperature rise
-
Combustion chamber soot accumulation
-
Heat exchanger fin erosion
-
Refractory deterioration
-
Bypass valve calibration drift
-
Pressure switch activation consistency
A 50-degree stack temperature increase over baseline indicates 20% efficiency loss and roughly $400-600 in wasted gas annually for residential heaters. That same temperature rise in commercial units could mean $2,000+ in excess fuel costs. The inspection tells you when replacement becomes economically justified.
Parts-kit strategies tied to equipment age
Managing parts inventory for lifecycle maintenance requires a different approach than stocking for repairs. You're pre-positioning components for scheduled replacements based on equipment age distributions across your service base.
Your pump population might look something like this:
| Age Range | Count and notes |
|---|---|
| 0-2 years | 80 pumps (mostly warranty, minimal parts needs) |
| 2-4 years | 120 pumps (seal kits, occasional bearing) |
| 4-6 years | 70 pumps (complete rebuild kits likely) |
| 6+ years | 30 pumps (replacement candidates) |
Those 120 pumps in the 2-4 year range will need approximately 40 seal kits over the next year based on typical failure rates. The 70 older pumps might need 20-25 rebuild kits. Carrying less means emergency parts runs and delayed repairs. Carrying more ties up working capital in slow-moving inventory.
Age-Based Parts Kitting:
Years 1-2 Kit:
-
Lid o-rings
-
Drain plugs
-
Pump baskets
-
Basic gaskets
Years 2-4 Kit:
-
Mechanical seals
-
Shaft seals
-
Diffuser gaskets
-
Volute gaskets
-
Starting capacitors
Years 4-6 Kit:
-
Complete seal/gasket sets
-
Bearings
-
Impellers
-
Wear rings
-
Run capacitors
End-of-Life Kit:
-
Used for evaluation only
-
Minor gaskets for temporary repairs
-
Focus on replacement quotes
Keep a rolling 12-month forecast aligned to age cohorts to avoid stockouts.
This approach ties directly into operational workflows by making sure techs have parts for predictable failures without excessive inventory. When a tech inspects a 3-year-old pump showing seal weepage, they already have the seal kit on the truck.
Replacement triggers and escalation criteria
The hardest operational decision in equipment maintenance isn't when to service—it's when to stop servicing and recommend replacement. Every rebuild extends equipment life but increases catastrophic failure probability. You need clear replacement triggers based on cumulative repair costs and failure risks.
For pumps, typical replacement triggers include:
-
Cumulative repair costs exceed 60% of replacement cost
-
Third major component failure (seal, bearing, motor)
-
Efficiency degradation over 25% from new
-
Vibration levels indicating imminent bearing failure
-
Age exceeding 150% of expected service life
But these triggers need escalation paths. A residential customer might accept higher failure risk to defer replacement costs. A commercial property with regulatory requirements can't risk equipment failure during peak season.
Residential Escalation Path:
-
First trigger hit
Document and inform customer at next service
-
Second trigger hit
Written recommendation with cost comparison
-
Third trigger hit
Require signed acknowledgment of failure risk
-
Critical safety trigger
Immediate shutdown and replacement quote
Commercial Escalation Path:
-
First trigger hit
Immediate notification to property manager
-
Second trigger hit
Formal replacement planning meeting
-
Third trigger hit
Equipment tagged for replacement within 60 days
-
Critical trigger
Emergency replacement authorization
Every rebuild extends equipment life but increases catastrophic failure probability, so clear escalation and documentation are essential for both customer communication and operational planning.
Converting reactive repairs to predictable replacements
The shift from reactive to predictive maintenance fundamentally changes your business model. Instead of emergency calls and rushed repairs, you're managing scheduled replacements with known costs and timelines. This transition requires robust data collection and analysis capabilities that most pool service companies lack.
Manual tracking falls apart quickly. You're monitoring hundreds of pieces of equipment, each with different inspection schedules, threshold values, and replacement triggers. A tech might inspect 5-8 pieces of equipment daily, generating dozens of data points that need comparison against historical trends and trigger thresholds.
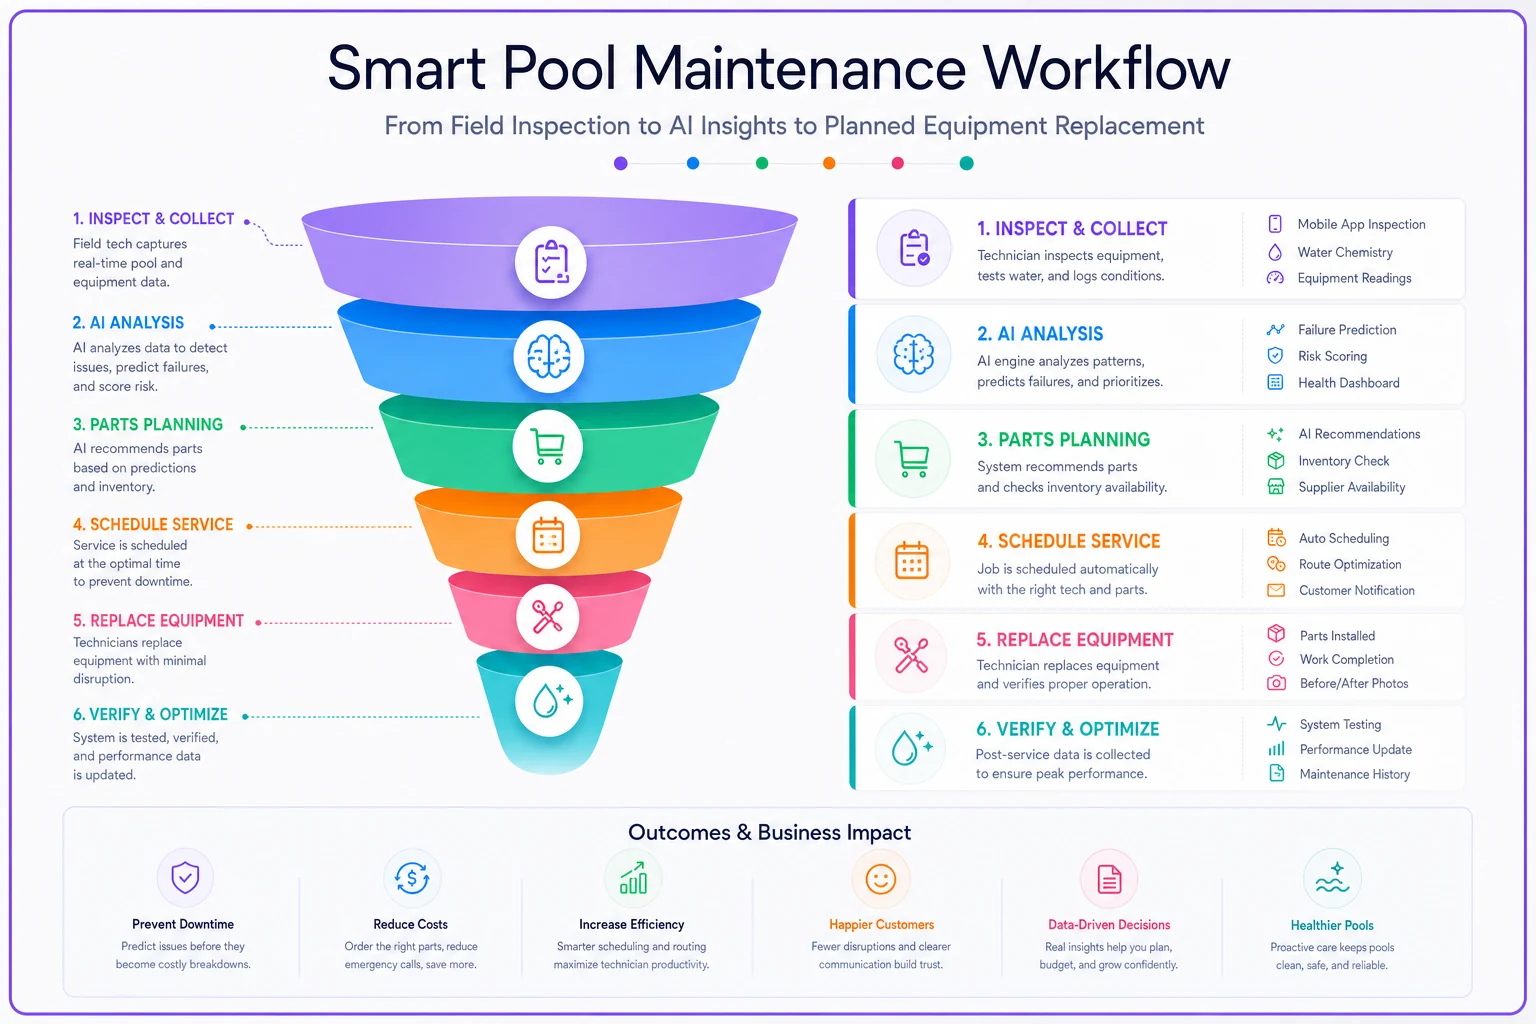
This illustrates the workflow from inspections to predictive maintenance actions.
AI-powered operational software transforms maintenance management. These platforms track every inspection reading, automatically flag values outside normal ranges, and predict failure timelines based on degradation curves. When a tech enters a pump amperage reading 12% above baseline, the system calculates remaining service life and generates parts orders for the predicted failure window.
The AI components handle pattern recognition across your entire equipment population. If 30% of a specific pump model fails around the 4-year mark under similar conditions, the system adjusts maintenance schedules for all similar units approaching that age. It learns from every failure, continuously refining prediction accuracy and optimizing parts stocking levels.
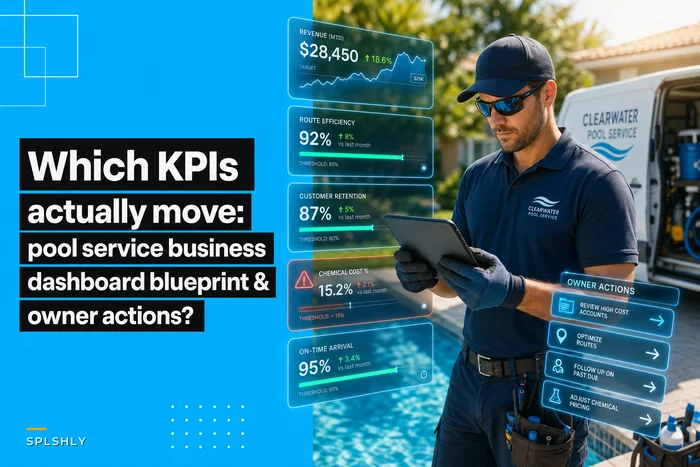
These platforms connect maintenance data to business KPIs, showing exactly how predictive maintenance impacts profitability:
-
Emergency call reduction percentage
-
Parts inventory turnover improvement
-
Labor hours shifted from repairs to maintenance
-
Customer equipment uptime statistics
-
Revenue per equipment lifecycle
These platforms connect inspection data to business outcomes so you can measure and optimize the financial impacts of predictive maintenance.
Real implementation at a 200-pool route
A San Antonio pool service company with 200 residential pools implemented lifecycle-based maintenance after dealing with constant emergency repairs. They previously used generic 6-month service intervals regardless of equipment age or condition.
Their initial equipment audit showed:
-
About one-third of pumps were over 5 years old
-
Nearly 20% of heaters showed efficiency degradation over 20%
-
Almost half the filters operated above optimal pressure differentials
-
Average equipment age was 4.2 years
-
Emergency repair calls averaged 18-22 monthly
They restructured their entire maintenance approach:
Phase 1: Data Collection (Months 1-2)
-
Catalogued every piece of equipment with age and history
-
Established baseline performance metrics
-
Created age-based inspection protocols
-
Trained techs on degradation indicators
Phase 2: Protocol Implementation (Months 3-6)
-
Shifted from calendar to lifecycle scheduling
-
Pre-positioned parts based on equipment age distribution
-
Implemented escalation triggers for replacement decisions
-
Began tracking all inspection measurements
Phase 3: Optimization (Months 7-12)
-
Refined inspection thresholds based on actual failures
-
Adjusted parts stocking to match replacement patterns
-
Developed customer-specific escalation procedures
-
Integrated predictive analytics for failure timing
After 12 months:
-
Emergency calls dropped to 6-8 monthly
-
Parts inventory turns increased from 4 to 7 annually
-
Technician overtime reduced by approximately 40%
-
Equipment replacement revenue increased $8,000-10,000 monthly
-
Customer retention improved from 87% to 94%
The key wasn't just the technical protocols—it was building systematic processes connecting inspection data to maintenance decisions to parts availability.
Why lifecycle focus beats calendar-based maintenance
Calendar-based maintenance assumes all equipment ages equally, but reality proves otherwise. A pool pump might run 2,000 hours annually at one property and 5,000 at another. Using the same annual service schedule means you're either over-maintaining the low-use pump or under-maintaining the high-use one.
Lifecycle-focused maintenance adapts to actual equipment condition and usage patterns. You're not changing pump seals because it's been 18 months—you're changing them because inspection shows 0.012" shaft play and 8 drops per minute leakage. This precision prevents premature parts replacement while catching degradation before it causes failure.
The financial impact compounds over time. Extending average equipment life by 18 months across a 200-pool route could defer $150,000-200,000 in replacement costs. Meanwhile, reducing emergency repairs by 60% might save $30,000-40,000 annually in overtime and rushed parts ordering.
The real value comes from customer relationships. Property owners notice when their equipment runs longer with fewer emergencies. They appreciate proactive replacement recommendations backed by inspection data rather than sudden failure notifications. This trust translates directly into higher service contract retention and increased replacement equipment sales. The challenge for most pool service businesses isn't understanding these benefits—it's implementing systems to capture and act on lifecycle data consistently. Modern operational platforms make the difference, turning complex maintenance protocols into simple, trackable workflows that any technician can follow. The question isn't whether to adopt lifecycle-based maintenance, but how quickly you can implement it before equipment failures erode your customer base.
Ready to elevate your pool service business?
Join hundreds of pool service professionals using Splshly to save time, optimize routes, and enhance customer satisfaction.