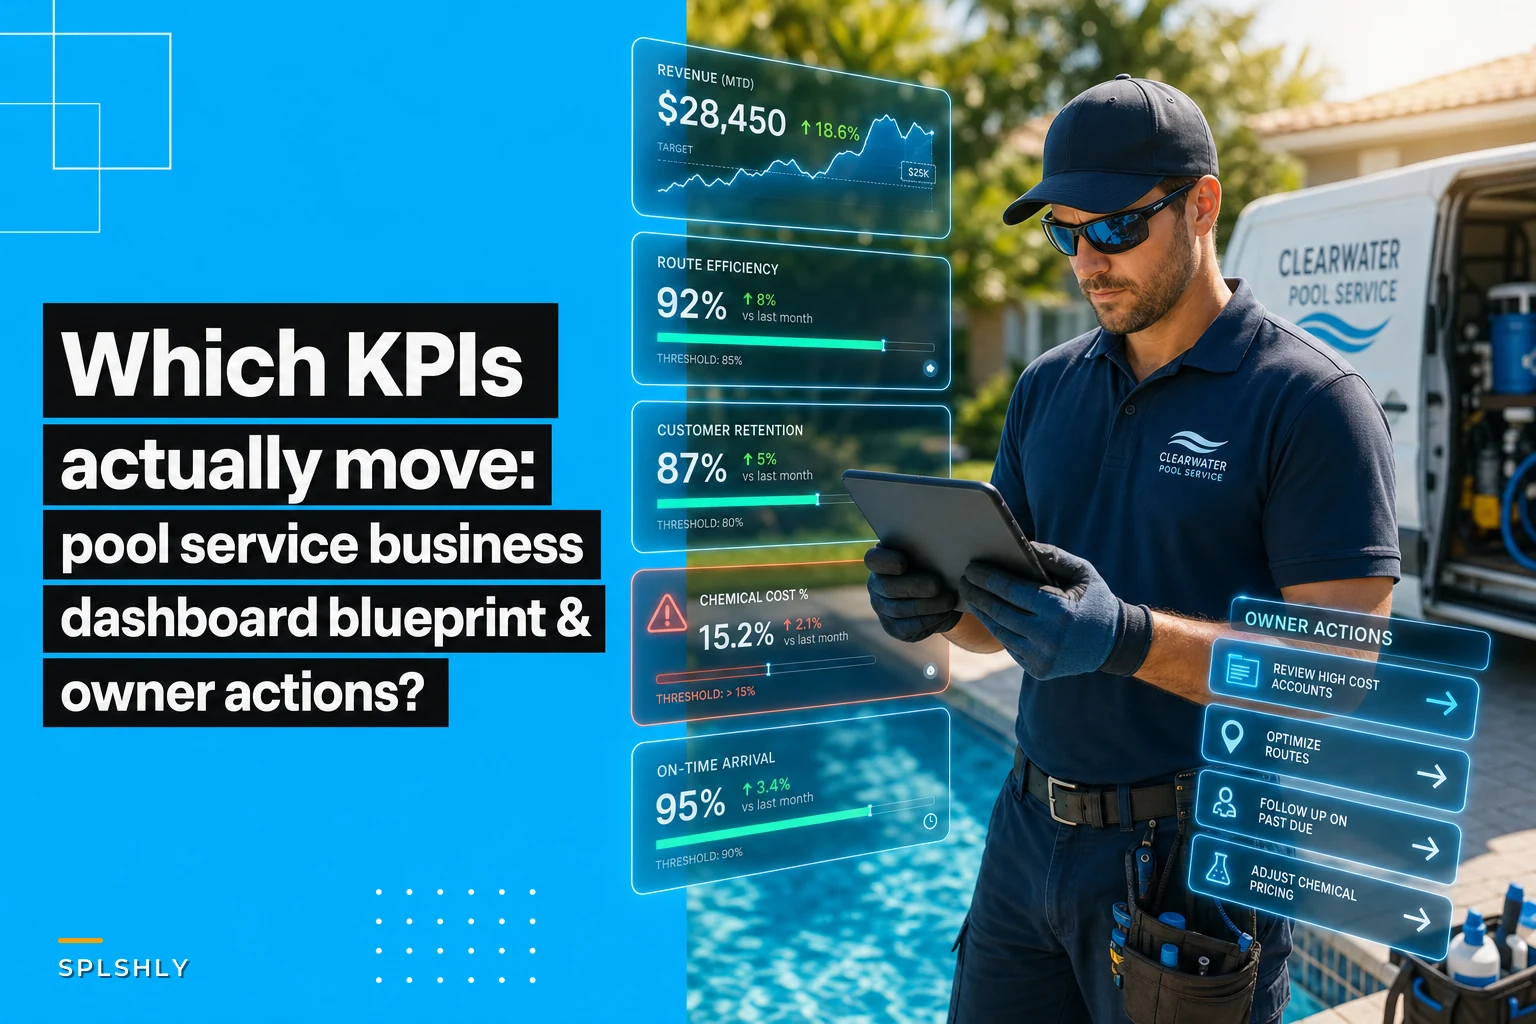

You know that expensive dashboard software your pool service business paid for? The one showing 47 different metrics in real-time? Yeah, the one nobody actually looks at anymore except when something breaks.
Most pool service owners have this backwards. They buy dashboard tools thinking more data visibility equals better operations. But here's what actually happens: technicians ignore the dashboards, managers check them occasionally, and owners only dig in when revenue drops. Meanwhile, critical operational decisions happen based on gut feeling and whoever yells loudest.
The real issue isn't lack of data. It's that nobody knows which numbers actually matter, what thresholds should trigger action, and who exactly needs to do what when those thresholds get crossed.
The dashboard graveyard problem
Pool service businesses generate tons of operational data. Route completion times, chemical usage per pool, customer complaints, technician efficiency scores, equipment failure rates. Most operations software dumps all this into colorful charts thinking that's helpful.
But operational data without context is just expensive wallpaper.
A typical pool service company with 15 technicians and 400 weekly stops generates around 2,000 data points daily. Chemical readings, service completion times, customer interactions, inventory movements. Traditional dashboards display all of this equally, creating metric paralysis - so many numbers that nothing stands out as actionable.
When something actually needs attention, it gets buried under routine variance. Your top technician takes an extra hour on Tuesday routes because of traffic. System flags it red. Meanwhile, three customers haven't been serviced in two weeks but that metric sits quietly in green because it's measuring completion rate, not service gaps.
Building KPI hierarchies that actually drive decisions
Tier 1: Daily Operational Triggers These metrics need immediate action when thresholds break. Not tomorrow, not at the weekly meeting. Right now.
Eliminate missed appointments and dispatch delays.
Splshly ensures every pool service is scheduled, tracked, and completed efficiently.
- Unified scheduling dashboard
- Automated customer reminders
- Technician route optimization
No credit card required
Tier 2: Weekly Performance Indicators Pattern metrics that reveal developing problems before they become emergencies.
Tier 3: Monthly Strategic Measures Business health metrics that inform larger operational decisions.
The difference between this and traditional dashboards? Every metric has an explicit threshold, an assigned owner, and a required action. No interpretation needed.
Tier 1 Daily Triggers: The stop-everything metrics
Same-day service misses Threshold: Any scheduled service not started by 3 PM Owner: Route coordinator Action: Call customer immediately, dispatch backup tech or reschedule with compensation offer
This isn't about perfection. Routes get delayed. But when a pool isn't serviced on its scheduled day, that customer notices immediately. Their pool turns green, their party gets ruined, and they start shopping for new service providers.
Chemical inventory depletion rate Threshold: Less than 3 days of average usage remaining for any core chemical Owner: Inventory manager or lead technician Action: Place emergency order if regular delivery won't arrive in time
Running out of chlorine tablets seems basic, but established companies lose $15k in monthly recurring revenue because they couldn't maintain pools properly for two weeks while waiting for chemical deliveries. Your technicians can't fix pools without chemicals, no matter how skilled they are.
New customer first service completion Threshold: First service not completed within 48 hours of signup Owner: Operations manager Action: Priority dispatch, personal call from owner if needed
First impressions in pool service are everything. That new customer just fired their last company. They're skeptical. If you miss their first service, you've confirmed their worst fears about pool companies being unreliable.
Technician no-show alert Threshold: Any technician not logged into route by start time + 30 minutes Owner: Route coordinator Action: Call technician, begin route redistribution if no response in 15 minutes
This catches everything from oversleeping to emergencies to technicians quitting without notice. The 30-minute buffer prevents false alarms from minor delays while ensuring routes get covered before customers notice.
Tier 2 Weekly Performance: Catching problems before customers complain
Weekly metrics reveal operational decay before it becomes visible to customers. Review these every Monday morning, no exceptions.
Route completion efficiency Calculation: (Scheduled stops completed / Total scheduled stops) x 100 Threshold: Below 95% for any route Owner: Operations manager Action: Route audit required, identify if it's a technician, logistics, or scheduling issue
A route running at 92% completion might seem fine. But that means 8 out of 100 pools aren't getting serviced properly. Over a month, some pools miss multiple services. Those customers will leave, and they'll tell their neighbors why.
Chemical cost per pool Calculation: Total chemical cost / Number of pools serviced Threshold: 20% above 3-month rolling average Owner: Lead technician Action: Technician retraining or pool audit to identify problem accounts
When chemical costs spike, something's wrong. Either technicians are overdosing pools (wasting money), pools have underlying problems (requiring diagnosis), or someone's taking chemicals home (requiring investigation). The 20% threshold filters out normal seasonal variation while catching real problems.
Customer contact rate Calculation: Customer-initiated contacts / Total active customers Threshold: Above 15% weekly Owner: Customer service lead Action: Contact analysis to identify common issues, proactive communication if pattern emerges
Normal customer contact rates hover around 8-12% weekly. When it jumps to 15%, something systematic is breaking. Maybe a new technician isn't balancing chemicals correctly, or route changes have confused customers about service days.
Technician productivity variance Calculation: Individual tech pools/hour vs team average Threshold: Any technician 25% below team average for 2 consecutive weeks Owner: Operations manager Action: Ride-along required, identify if it's training, equipment, or motivation issue
This catches problems traditional "pools per day" metrics miss. A technician might hit their daily target by rushing through services, creating quality problems. Or they might be thorough but inefficient, needing route optimization help.
Tier 3 Monthly Strategic: Steering the business
Monthly metrics inform bigger decisions about pricing, staffing, and growth. These get reviewed in detail on the first Tuesday of each month.
Lifetime value to acquisition cost ratio Calculation: (Average customer lifetime value) / (Customer acquisition cost) Threshold: Below 3:1 Owner: Business owner Action: Adjust pricing, improve retention, or reduce acquisition spending
Most pool service businesses operate between 3:1 and 5:1 ratios. When it drops below 3:1, you're essentially buying revenue at barely profitable rates. This usually means either your pricing is too low, retention is failing, or you're overspending on marketing.
Gross margin by service type Calculation: (Revenue - Direct costs) / Revenue for each service category Threshold: Below 55% for recurring maintenance, below 40% for repairs Owner: Business owner Action: Price adjustment or cost reduction required
Pool maintenance should run 55-65% gross margins. Repairs vary more but shouldn't drop below 40%. When margins compress, it's usually from underpricing, chemical waste, or excessive drive time between pools.
Technician retention cost Calculation: (Recruiting + Training + Lost productivity costs) / Number of techs replaced Threshold: Above $4,500 per technician Owner: Business owner Action: Review compensation, workload, and management practices
Replacing a trained pool technician typically costs $3,000-4,000 when you factor in recruiting, training, and the mistakes new technicians make. If you're spending more than $4,500, either your training is inefficient or you're losing technicians too fast.
Revenue per route mile Calculation: Monthly recurring revenue / Total monthly route miles driven Threshold: Below $3.50 per mile Owner: Operations manager Action: Route optimization or customer density improvement needed
This metric reveals inefficient routing that simple "pools per day" metrics miss. A technician might service 20 pools daily, but if they're driving 80 miles to do it, you're burning profit on fuel and vehicle wear. Efficient routes should generate $3.50-5.00 per mile driven.
Building the action system, not just the metrics
Having these KPIs means nothing without an execution system. The operational framework that makes data actually drive decisions.
Most companies get lost in analysis instead of action. You need clear protocols that eliminate discussion and focus on execution when thresholds break.
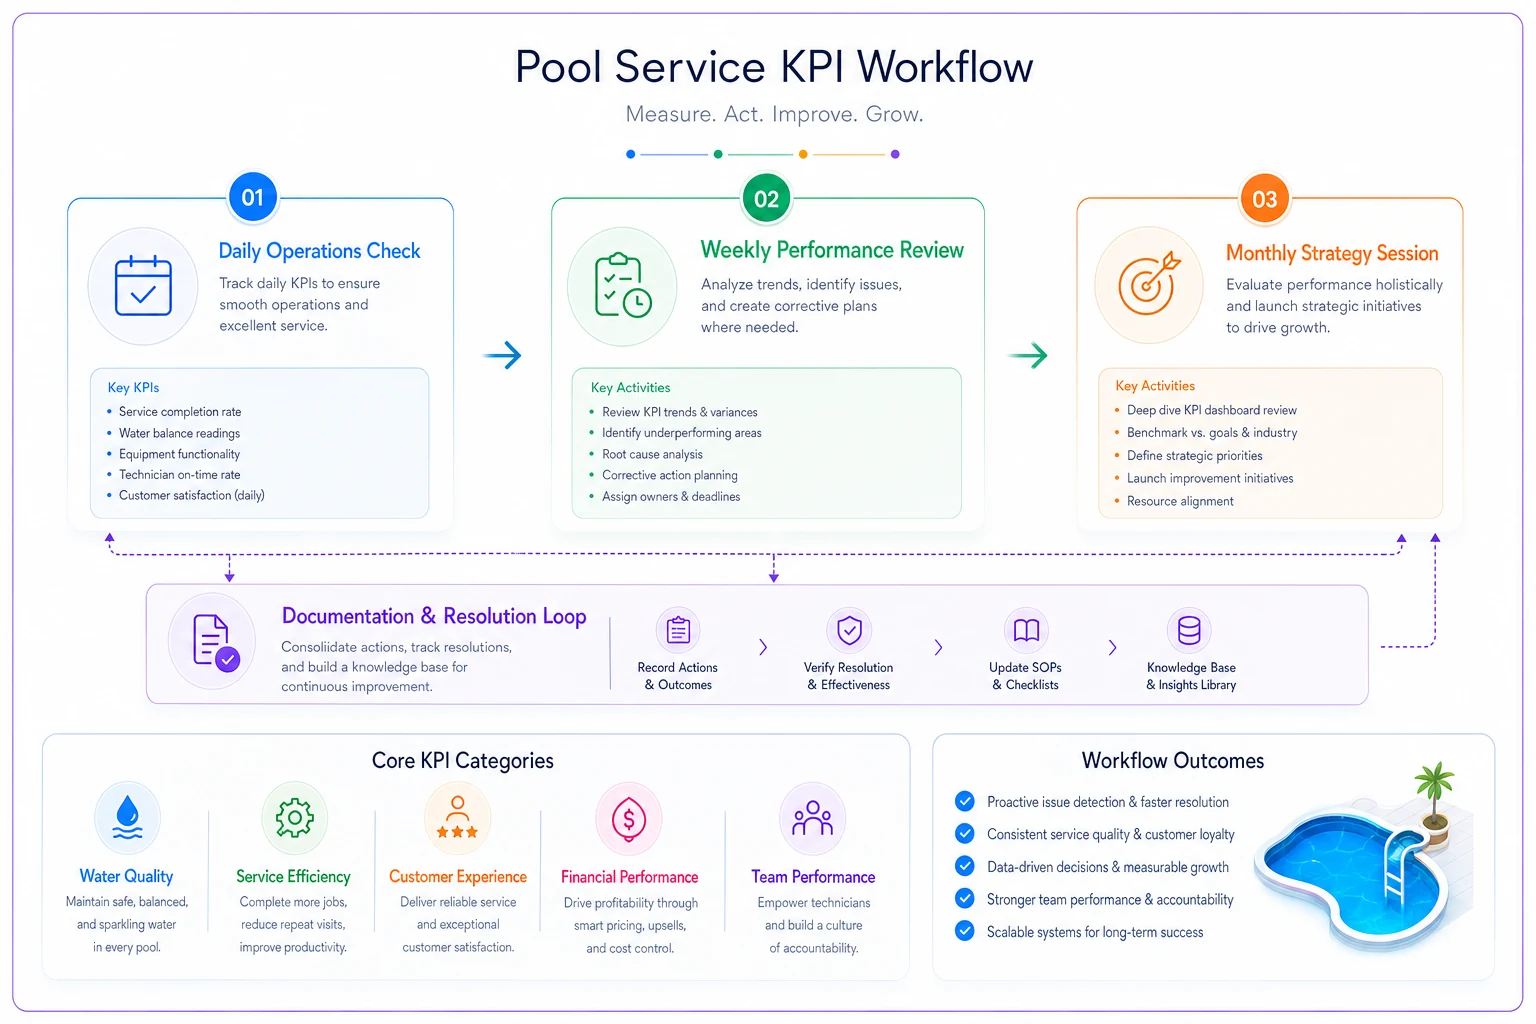
This workflow image summarizes how daily checks, weekly reviews, and monthly strategy sessions connect to immediate actions, corrective plans, and strategic initiatives.
Automate Tier 1 alerts to route coordinators via SMS so issues can be resolved before customers notice.
Daily Stand-up Protocol (8 AM, 10 minutes max)
-
Route coordinator reports any Tier 1 threshold breaks from previous day
-
Reviews today's schedule for potential triggers
-
Each threshold break gets an owner and deadline
-
No discussion of metrics within thresholds
Weekly Operations Review (Monday, 30 minutes)
-
Operations manager presents Tier 2 metrics
-
Only discuss metrics outside thresholds
-
Each issue gets specific action with deadline
-
No more than 3 corrective actions per week to maintain focus
Monthly Strategy Session (First Tuesday, 2 hours)
-
Owner reviews all Tier 3 metrics
-
Deep dive on any threshold breaks
-
Maximum 2 strategic initiatives launched per month
-
Clear success metrics defined for each initiative
You only discuss metrics that demand action. Everything else is working and doesn't need attention. Most pool service software shows you everything but tells you nothing.
Converting dashboard addiction to action systems
Instead of staring at dashboards hoping to spot problems, you get specific triggers that demand specific actions from specific people. When same-day service completion drops below threshold, the route coordinator doesn't need a meeting to discuss it. They pick up the phone and fix it.
Modern operational software works better when it converts data into triggers. AI-powered systems can monitor these thresholds continuously and alert the right person at the right time with the right context. The route coordinator gets notified about service misses while they can still fix them, not in tomorrow's report when customers are already angry.
The best operational improvements come from consistent execution of simple actions, not complex analysis of pretty dashboards. A pool service business that responds to threshold breaks within hours will outperform one with perfect dashboards that nobody acts on.
KPI Quick Reference Guide
Here's your complete breakdown of what to track, when to worry, and who takes action:
| KPI | Frequency | Threshold | Owner | Immediate Action |
|---|---|---|---|---|
| Same-day service completion | Daily | Any miss by 3 PM | Route Coordinator | Call customer, dispatch backup |
| Chemical inventory | Daily | <3 days supply | Inventory Manager | Emergency order if needed |
| First service completion | Daily | >48 hours | Operations Manager | Priority dispatch |
| Technician no-show | Daily | Start + 30 min | Route Coordinator | Contact, redistribute routes |
| Route completion rate | Weekly | <95% | Operations Manager | Route audit |
| Chemical cost per pool | Weekly | >20% above average | Lead Technician | Training or pool audit |
| Customer contact rate | Weekly | >15% | Service Lead | Issue analysis |
| Tech productivity variance | Weekly | <25% below average | Operations Manager | Ride-along required |
| LTV:CAC ratio | Monthly | <3:1 | Owner | Pricing/retention review |
| Service gross margins | Monthly | <55% maintenance, <40% repair | Owner | Price or cost adjustment |
| Tech replacement cost | Monthly | >$4,500 | Owner | Review retention practices |
| Revenue per route mile | Monthly | <$3.50 | Operations Manager | Route optimization |
Here's your complete breakdown of what to track, when to worry, and who takes action:
When this system works (and when it doesn't)
This KPI framework works best for pool service businesses with specific characteristics that allow the metrics to be meaningful and actionable.
Where it excels:
-
5+ technicians (enough volume for patterns)
-
200+ regular service accounts (statistical significance)
-
Basic operational software in place (data capture capability)
-
Clear ownership structure (people who can make decisions)
Where it struggles:
-
You're a solo operator or very small team (not enough data volume)
-
Your routes are severely understaffed (everything is always red)
-
You have no digital systems (paper-based operations)
-
There's no clear decision-making authority (committee-run businesses)
The businesses that see the biggest impact are those drowning in data but starving for decisions. They have dashboards, reports, and metrics everywhere but can't answer "What should we do differently today?"
Real scenario: From 47 metrics to 12 that matter
A Phoenix pool service company with 18 technicians and roughly 520 weekly accounts was tracking everything. Daily reports ran 15 pages. Their operations manager spent two hours every morning analyzing dashboards. Yet service quality kept declining and customer churn hit 8% monthly.
The problem wasn't lack of information. It was too much information without action triggers. Technicians knew their personal stats but not what to improve. Managers saw problems but didn't know which ones to prioritize. The owner got beautiful reports but no clear decisions.
After implementing this tiered KPI system, they cut their tracked metrics from 47 to these 12. Each metric got an owner and an action threshold. Daily standups dropped from 45 minutes to 10. The operations manager spent 30 minutes on metrics instead of two hours.
-
Customer churn dropped to around 4.5% monthly
-
Route completion improved from 89% to 96%
-
Chemical costs decreased roughly 18%
-
Technician overtime hours fell by about a third
The difference wasn't better data. It was knowing exactly which data mattered and what to do when thresholds broke.
Building your action-trigger system
Stop measuring everything that moves. Stop building dashboards nobody uses. Instead, identify the 10-15 numbers that actually predict customer satisfaction and profitability in your pool service business.
Give each metric an owner who can take action without permission. Set thresholds that matter - not perfection, but the point where customers notice or profits erode. Create simple, specific actions for threshold breaks. No meetings, no analysis paralysis, just clear next steps.
The goal isn't to monitor your business better. It's to run your business better. The difference between successful pool service companies and those that struggle isn't access to data. It's the ability to convert data into decisions, consistently and quickly.
Modern AI-assisted operational platforms excel at this conversion. They monitor thresholds continuously, alert the right people immediately, and even suggest specific actions based on what's worked before. But whether you use advanced software or simple spreadsheets, the principle remains: measure what matters, set clear triggers, and act fast when thresholds break.
Your pool service business doesn't need another dashboard. It needs an action system that turns numbers into decisions. Start with these 12 KPIs, adjust thresholds based on your operation's reality, and watch what happens when everyone knows exactly what to do when metrics shift.
Because at the end of the day, your customers don't care about your dashboards. They care that their pool is clean when promised.
These KPIs and action triggers ensure that happens, consistently, without the operational chaos that usually comes with growth.
Ready to elevate your pool service business?
Join hundreds of pool service professionals using Splshly to save time, optimize routes, and enhance customer satisfaction.