



Executive summary: Build the operating system before you scale headcount: prioritized SOPs, a repeatable onboarding cohort cadence, a layered QA program with statistical sampling, and hard KPI hiring/stop triggers. This playbook is systems‑first and operationally prescriptive: templates, math, week‑by‑week checklist, audit forms, hiring triggers, role descriptions, and dashboard specs so you can scale toward 30 technicians without losing quality.
Downloadable kit (stable short URLs): 6‑Month Tactical Checklist (PDF + HTML summary), SOP template (fillable), Audit form (spreadsheet & printable PDF), Financial & capacity model (spreadsheet). These are generic templates — replace placeholders like {companyname}, {techname} before use.
Downloadable kit (stable short URLs)
Use these stable short URLs to download the kit. Replace placeholders in templates before use.
-
6‑Month Tactical Checklist (PDF + HTML summary)
https://splshly.com/kit/scale-playbook-6mo.pdf
-
SOP template (fillable)
https://splshly.com/kit/sop-template.docx
-
Audit form (spreadsheet & printable PDF)
https://splshly.com/kit/qa-audit-form.pdf
-
Financial & capacity model (spreadsheet)
https://splshly.com/kit/capacity-financial-model.xlsx
Note: These are generic templates — replace placeholders like {companyname}, {techname} before use.
One‑page 6‑month tactical checklist — embedded summary (week‑by‑week, owner, acceptance)
Week-by-week owners, actions, due windows, and acceptance criteria for the first six months.
Eliminate missed appointments and dispatch delays.
Splshly ensures every pool service is scheduled, tracked, and completed efficiently.
- Unified scheduling dashboard
- Automated customer reminders
- Technician route optimization
No credit card required
-
Weeks 1–2 (Owner
Founder / Ops Lead) — Action: Publish core SOPs: Weekly Service, Safety & PPE, Chemical Testing & Adjustment, Customer Arrival & Closeout. Due window: Days 1–14. Acceptance: SOPs live in KB; 3 techs can recite 30‑second quick reference for each SOP. Pass/fail: checklist completeness ≥ 95%.
-
Weeks 3–4 (Owner
Ops Lead / Lead Tech) — Action: Set baseline KPIs (FTFR, route completion, chemical cost/pool, revisit rate), instrument FSM events, add photo rules. Acceptance: Daily dashboard shows baselines for 14 days. Pass if data capture ≥ 95% of service records.
-
Weeks 5–8 (Owner
Hiring Lead / Trainer) — Action: Run first hiring cohort (3 techs); run 0–30 day onboarding program; 100% audit on new hires. Acceptance: Each new hire completes 10 supervised services; knowledge test ≥ 80% AND 100% supervised audit pass (no critical safety misses).
-
Weeks 9–12 (Owner
Ops Lead / QA Lead) — Action: Implement peer audits, dispatch huddle, route optimization trial; hire dispatcher if scheduling >1 hour/day. Acceptance: Route completion ≥ 95% rolling 2 weeks; photo documentation ≥ 85%.
-
Weeks 13–20 (Owner
Service Manager / Recruiting) — Action: Hire second cohort (5 techs) if KPI gates hold; add Lead Tech role; expand QA sampling per statistical plan. Acceptance: Pod(s) meet QA pass rate ≥ 90% and FTFR within acceptable band (see KPI page).
-
Weeks 21–26 (Owner
Ops Director) — Action: Add operations coordinator, implement inventory PARs, run operating‑system audit, finalize 90‑day review of first cohorts. Acceptance: No critical audit failures in last 30 days; pipeline buffer ≥ 10% active candidates.
Download: the one‑page PDF includes the same checklist with fillable “Pass/Fail” and signature fields.
Core SOP template (fillable)
Copy this template into your KB or LMS and replace placeholders.
-
Title
-
Purpose / Scope
-
Owner
-
Approver
-
Tools / PPE / Forms
-
Quick reference (30s)
-
Inputs (what you need before starting)
-
Step‑by‑step procedure (numbered)
-
Acceptance checks (pass/fail criteria with measurement)
-
Exceptions / Escalations (criteria and contact)
-
Required photos & metadata
-
Revision history
Three prefilled example SOPs (shortened; copy from templates)
Three short example SOPs you can copy into the template and expand.
-
Safety & PPE (example) — Title
On‑Site Safety & PPE — Weekly Service. Purpose: Prevent injury, ensure compliance for chemical handling. Owner: Safety Lead / Trainer. Quick reference: Always wear eye protection + chemical‑resistant gloves when handling bulk chemicals; always run an ambient air check in enclosed equipment closets. Acceptance checks: PPE worn on 100% of audited visits; missed PPE triggers corrective coaching. Escalation: If a chemical spill occurs, follow the Chemical Spill Response SOP and notify Ops Lead within 30 minutes.
-
Chemical Testing & Adjustment (example) — Title
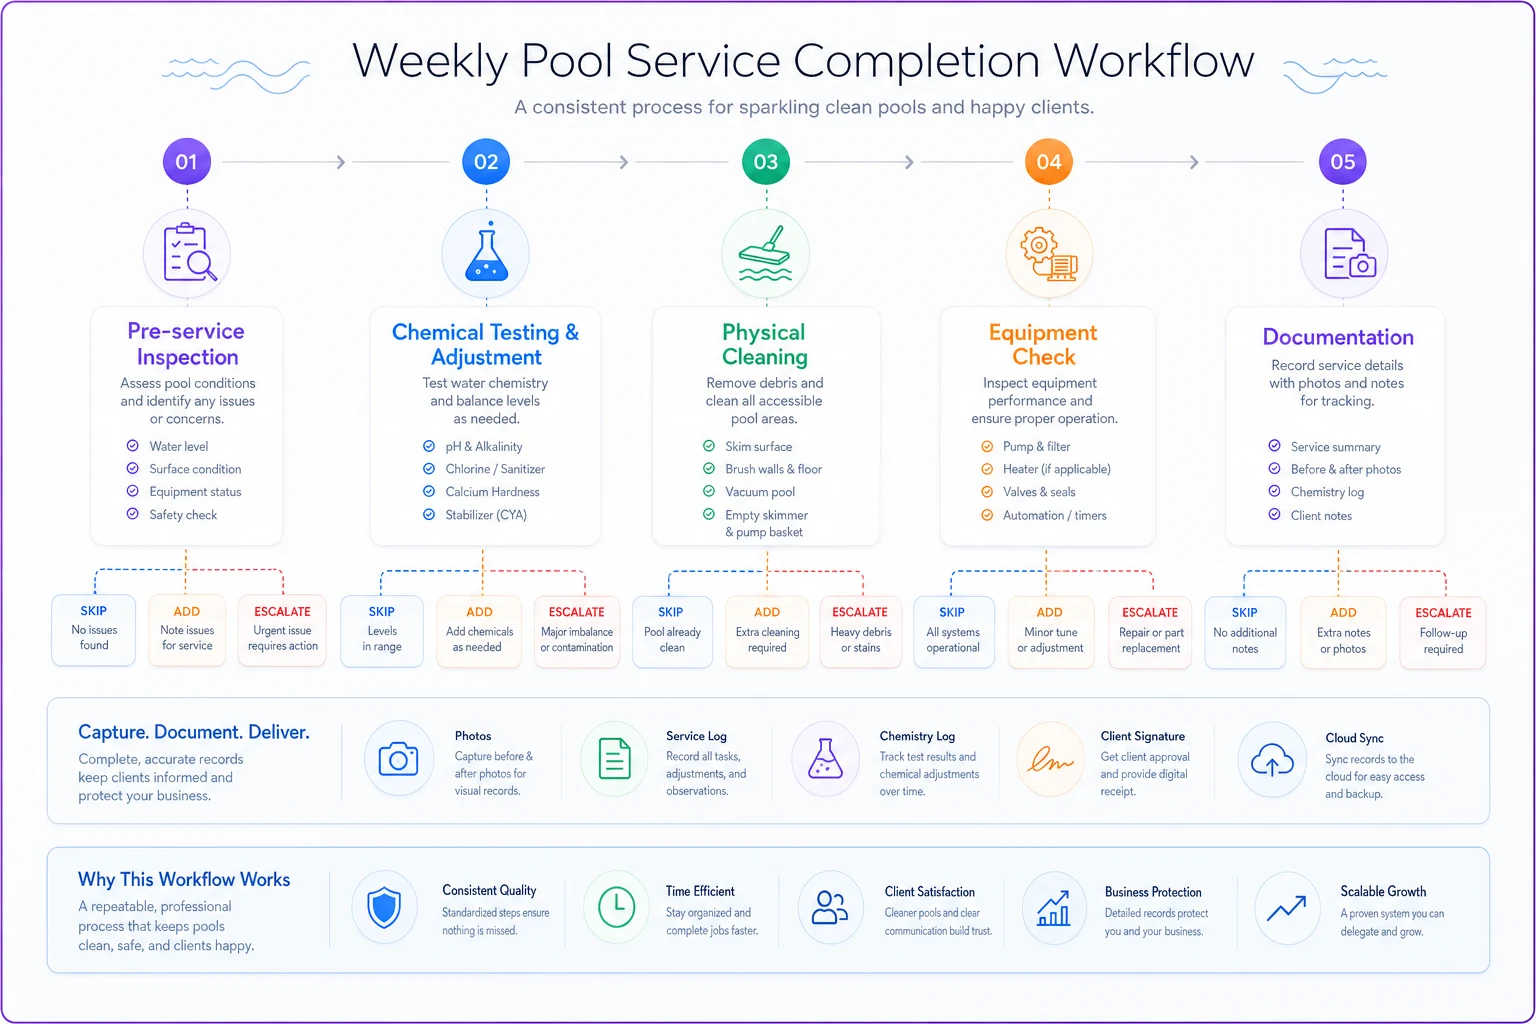
Weekly Chemical Test & Adjustment. Why: Keeps pools swim‑ready and reduces downstream corrective visits. Tools: test strips/digital meter, dosing calculator, chemical log sheet. Steps (summary): Test free chlorine → pH → alkalinity (if pH off) → decide dosing using dosing table; never add >2 lbs of any single dry chemical per visit; wait 4 hours between acid and chlorine; log before+after values. Acceptance: After dosing, field log shows before/after values and amount added; no critical overdoses. Escalation: If required dose > $20 or >2 dosing events in a week, notify office for customer approval.
-
Customer Arrival & Closeout (example) — Title
Customer Arrival, Interaction & Closeout. Quick reference: Greet, explain work, show before photos, do work, show after photos, collect digital sign or confirmation. Steps: Arrival photo, short script, confirm special instructions, run service, take required photos, update FSM job notes with codes, send completion text with photo. Acceptance: Completion message sent within 30 minutes of job completion with required photo(s).
0–90 day technician onboarding checklist (detailed gates)
Detailed gates for onboarding and progression through 0–90 days with pass/fail criteria and remediation steps.
-
Day 0 (Orientation) — Paperwork (I‑9/W‑4 equivalents), vehicle & tool check, safety orientation, account & app access, shadow assignment. Owner: HR / Ops Coordinator.
-
Days 1–7 (Shadow & observe; required supervised job count
4–6) — Shadow veteran tech; complete microtraining modules; complete knowledge quiz (pass threshold: 70%). Gate to next stage: supervisor sign‑off on 6 observed jobs OR knowledge score ≥70%.
-
Days 8–30 (Supervised execution; required supervised job count
10 total) — 50% shadow / 50% assist/execute with trainer oversight; complete practical assessments; begin daily self‑audits (photo submission). Pass criteria: 10 supervised services completed, no critical safety misses, QA pass rate on supervised audits ≥90% (no critical failures).
-
Days 31–60 (Solo with increased audits) — Solo dispatch with weekly peer audits; manager audits twice per week; expected productivity ramp to ≥70–80% of veteran mean. Gate: Knowledge test ≥80% AND two consecutive weeks QA pass rate ≥85% to reduce audit frequency.
-
Days 61–90 (Reduced audit cadence) — Random audits 10–20% of jobs; peer coaching as needed. Graduation gate to fully independent/schedule expansion: QA pass rate ≥90% and time per job within ±25% of veteran mean for 2 consecutive weeks.
-
Failing gates
Extend supervision by additional 5–10 service visits and targeted remediation checklist.
Explicit hiring / headcount math and sample models
Core formulas and example calculations to determine required technicians and hiring triggers. Adjust targetpoolsper_tech to tune to your trade and geography.
Core formula (adjustable parameter: targetpoolspertech): requiredtechs = ceil(totalpools / targetpoolspertech).
Hiring trigger formula (cohort start): beginhiringcohort if (requiredtechs − currenttechs) ≥ 0.5 OR utilization > 85% sustained for 2 weeks.
| target_pools_per_tech | required_techs (example for total_pools = 2,250) |
|---|---|
| 60 | ceil(2,250 / 60) = 38 |
| 75 | ceil(2,250 / 75) = 30 |
| 85 | ceil(2,250 / 85) = 27 |
Example calculation: totalpools = 2,250; targetpoolspertech = 75 → requiredtechs = 2,250 / 75 = 30 → need 30 techs. Example small shop: totalpools = 460; target = 75 → requiredtechs = 6.13 → when currenttechs = 6 and utilization >85% or pipeline insufficient, begin hiring a cohort (3–5).
Hiring milestones, cohort cadence, pipeline buffer (months 1–6)
Recommended phased hiring and staffing additions for months 1–6 with pipeline guidance.
-
Phase 0 (Weeks 0–4)
Foundation — Staffing: Founder + 1 Lead Tech + Trainer/QA (contract or combined). Build: Core SOPs, KB, baseline KPIs, recruiting funnel.
-
Phase 1 (Months 1–2)
Small cohorts — Hire: 3–5 technicians (cohort size 3–5). Goal: Validate onboarding and QA; recommended trainer:trainee ratio 1:4 (max 1:6 for short cohorts). Pipeline buffer: maintain 10–15% active candidates. Time‑to‑hire placeholder: 2–6 weeks (market dependent).
-
Phase 2 (Months 3–4)
Scale cohorts — Hire: 5–8 technicians across 1–2 cohorts. Add: Lead Tech(s) (promote internally if possible), 1 dispatcher if scheduling >1 hr/day.
-
Phase 3 (Months 5–6)
Stabilize & expand — Hire: 5–8 more technicians (conditional on KPI gates). Add: Ops Coordinator, Fleet/Inventory specialist.
-
Pipeline guidance
keep 10–15% pipeline to allow for natural attrition and offer decline rates.
Role job descriptions & time allocation templates
Summaries of key roles, primary responsibilities, time allocation examples, and promotion criteria.
-
Lead Technician — Primary
Technical execution + field leadership. Time allocation example: 60% billable field work / 30% coaching & ride‑alongs / 10% audits/admin. Promotion criteria: QA pass rate ≥ 95% for 90 days, low callback rate, demonstrated coaching aptitude.
-
Trainer / QA Lead — Primary
onboarding, audit program, SOP updates. Time allocation: 40% training & audits / 40% documentation & course updates / 20% field support. Promotion criteria: successful cohort graduation rates, reduction in rework rates.
-
Service Manager — Primary
daily operations, KPIs, escalations. Time allocation: 30% people management / 30% scheduling & routing oversight / 20% KPI analysis / 20% customer escalations.
-
Ops Coordinator — Primary
inventory management, parts procurement, vehicle readiness. Time allocation: 50% inventory & procurement / 30% admin support / 20% coordination.
-
Dispatcher — Primary
scheduling, ETA updates, exception handling. Time allocation: 80% scheduling & communication / 20% reporting.
-
Fleet & Inventory Specialist — Primary
PAR levels, replenishment, truck kitting. Time allocation: 70% inventory ops / 30% vendor coordination.
QA auditing program with statistical sampling rationale
A statistical approach to QA sampling designed to detect problem prevalence with confidence and operational rules for audits and escalations.
Goal: detect a problem prevalence p0 with confidence (1 − α). Use binomial no‑defect formula to calculate minimum sample n so the chance of seeing zero defects when true defect rate = p0 is ≤ α. Formula (worked): n ≈ ln(α) / ln(1 − p0).
Worked example: detect a true problem rate p0 = 10% at 95% confidence (α = 0.05): n ≈ ln(0.05) / ln(0.90) ≈ 28.44 → sample 29 jobs.
-
Operational rules (recommended)
New hires: 100% of their first 2 weeks audited. Early taper: Weeks 3–8 audited at 50% of jobs. Steady state: random monthly management audits = max(10% of tech's monthly services, 15–30 samples per tech) — pick the larger of the two.
-
Conditional increases
if audit failure rate > threshold (e.g., 10% failures) then escalate to 100% audits for the tech/cohort until remediation.
-
Escalation rules
1–2 minor failures in an audit: coach + re‑audit within 2 weeks. ≥1 critical safety failure OR failure rate in cohort >15%: pause hiring, 100% audits for cohort, mandatory retraining within 7 days. 30%+ audit failure cascade: stop new work allocation from affected techs until cleared.
QA artifacts (download links)
Links to audit forms and brief peer audit checklist excerpt.
-
Audit scoring rubric (download)
https://splshly.com/kit/qa-audit-form.pdf
-
Peer audit checklist (inline excerpt)
Was pre‑service check completed? (Y/N); Chemical readings logged? (Y/N); Required photos submitted? (Y/N); Equipment anomalies noted? (Y/N + note); Overall pass (≥4/5).
-
Remediation workflow (owner & SLA)
Owner: Trainer/QA Lead. SLA: Critical safety issues — 24 hours; major quality issues — 3 business days; minor coaching issues — 7 days. Steps: 1) Notify tech + manager; 2) Assign targeted micro‑training; 3) Re‑audit within SLA; 4) Document closure in KB.
KPI definitions, formulas, bands, and dashboard alarm rules
Core KPIs, formulas, healthy/warning/critical bands, example SQL metric formulas, and alarm rules to trigger operational changes.
| KPI | Formula / Definition | Example bands (Healthy / Warning / Critical) |
|---|---|---|
| Route Completion Rate | Pools serviced / Pools scheduled × 100 | Healthy ≥ 95% / Warning 90–94% / Critical < 90% |
| First‑Time Fix Rate (FTFR) | Jobs resolved on first visit / Total jobs × 100 | Healthy ≥ 85% / Warning 75–84% / Critical < 75% |
| Technician Utilization | Billable hours / Total paid hours × 100 | Configurable; monitor >85% sustained as hiring trigger |
| Revisit Rate (48h) | Number of revisit jobs within 48h / Total jobs × 100 | Healthy ≤ 5% / Warning 5–8% / Critical > 8% |
| QA Pass Rate | Audits passed / Audits performed × 100 | Healthy ≥ 90% / Warning 80–89% / Critical < 80% |
| Chemical Cost Drift | abs(thisweekavg − baseline) / baseline × 100 | Alert if > 10% combined with QA pass rate < 90% |
Example SQL/metric formulas (conceptual) and alarm rules: Route Completion (daily) sample SQL; QA Pass Rate (rolling 30 days) sample SQL. Alarm examples: Trigger hire pause if FTFR drops below 80% for 2 consecutive weeks; Dispatch alert if Route Completion < 90% for a day and utilization > 80%; Chemical spike alert if Chemical Cost Drift > 10% week over baseline and QA pass rate < 90%.
KPI dashboard mockup & CSV/JSON spec
Assets and the minimal CSV/JSON fields required for dashboard ingestion. Placeholder mockup asset provided.
Mockup assets (placeholder): KPI dashboard mockup image: https://splshly.com/media/dashboard-mockup.png (alt text: "Dashboard mockup showing FTFR, Route Completion, QA Pass Rate, Chemical Cost Drift")
Minimal CSV header sample: date, techid, routeid, poolsscheduled, poolsserviced, billablehours, totalpaidhours, chemicalcost, revisitcount48h, auditsperformed, auditspassed
JSON sample: { "date":"2026-09-06", "techid":"T123", "poolsscheduled":22, "poolsserviced":21, "billablehours":6.5, "totalpaidhours":8.0, "chemicalcost":34.50, "revisitcount48h":0, "auditsperformed":3, "audits_passed":3 }
Tech stack wiring diagram & migration sequence (minimal stack)
Minimal stack order and integration priorities, vendor selection criteria, and recommended migration sequence. Include a wiring/process diagram for the stack.
-
Minimal stack (order & integration priorities)
FSM → Mobile checklists & LMS → Routing optimizer → QA tool → Inventory & parts → Dashboard/BI.
-
Vendor selection criteria
Data portability (CSV/JSON), open API, mobile offline support, configurable checklists, photo attachments, role/permission control.
-
Migration sequencing (recommended)
Phase A: Harden SOPs in KB → select FSM → migrate jobs & customers → enforce mobile checklists. Phase B: Pilot routing optimizer on one pod → measure drive time and route completion → roll out. Phase C: Add QA tool and integrate audit events into FSM job records.
-
Fallback plan
Maintain canonical exports weekly; keep a shared spreadsheet as temporary source of truth; have contracts with data‑export SLAs; maintain critical tasks as manual checklists until restored.
Financial & capacity model templates (spreadsheet guidance)
Inputs to capture in your financial & capacity model, simple break‑even example and note about downloadable spreadsheet with sensitivity tabs.
-
Inputs you must capture
avg revenue per pool/week (R), avg jobs per pool/week (J), targetpoolsper_tech (P), average billable hours per tech/day (H), hourly labor cost loaded (L), training cost per hire (T), average gross margin per hour (M%).
-
Simple headcount break‑even example
Revenue per tech/week = R P. Gross margin per tech/week = Revenue per tech/week M%. Training cost amortized per week = T / ramp_weeks. Break‑even when marginal gross margin covers loaded labor cost + training amortization.
-
Downloadable spreadsheet includes sensitivity tabs for P = 60/75/85.
Recruiting playbook artifacts (copyable)
Copyable recruiting artifacts: job description, interview scorecard, technical assessment scenario, background checks checklist, offer template, time‑to‑hire and cost placeholders.
-
Sample job description (short) — Title
Pool Service Technician — Residential; Responsibilities: weekly pool service, chemical testing/adjustment, equipment checks, photo documentation, customer communication, basic repairs; Requirements: valid driver's license, customer service aptitude, basic chemistry comfort, willing to train.
-
Interview scorecard (scored 1–5) — Safety mindset, chemical basics, tool & mechanical aptitude, customer communication, culture fit, willingness to learn. Pass if average ≥4 and no 1s in safety or ethics.
-
Technical assessment scenario — Give candidate a test strip/photo and ask for interpretation + dosing recommendation using a provided dosing chart.
-
Background checks & verifications checklist — ID, driving record, reference checks (2), right to work, drug screen if applicable.
-
Offer template (key fields) — Role, start date, compensation, hours, vehicle policy, probation period (90 days), training expectations.
-
Time‑to‑hire & cost placeholders — Fill into the financial model with local recruiter fees, job board costs, and internal sourcing time estimates.
Change management & enforcement
SOP adoption, trainer ratios, coaching cadence, non‑compliance steps, and SOP revision workflow.
-
SOP adoption plan
Publish KB + quick‑reference cards + in‑app checklists. Require completion of 3 microtraining modules before first solo service. Trainer sign‑off mandatory for gate progression.
-
Trainer‑to‑trainee ratios
Recommended 1 trainer : 4 trainees; short cohorts up to 1:6 acceptable for short windows.
-
Coaching cadence
Daily quick debrief first 2 weeks, weekly 30‑minute practical review weeks 3–8, monthly skills clinic ongoing.
-
Non‑compliance steps
1) Verbal coaching documented; 2) written action plan; 3) performance improvement plan; 4) suspension of solo duties until cleared.
-
SOP revision process
Owner updates SOP, QA Lead approves, versioned publish date, communicate changes in weekly sync.
Contingency & rollback checklist for quality regressions
Immediate triage steps, temporary hiring freeze checklist, retraining schedule, priority audits, and communication templates for quality regressions.
-
Immediate triage (first 24 hours)
1) Stop new hires for 7 days. 2) Increase audits to 100% for affected techs/cohorts. 3) Communicate to customers affected with remediation plan template.
-
Temporary hiring freeze checklist
Verify root causes, fix SOP or staffing gap, retrain affected techs, validate through audits before resuming hiring.
-
Retraining schedule
Mandatory cohort retrain within 7 days; targeted micro‑modules + hands‑on ride‑alongs.
-
Priority audits
Audit top 30 pools by revenue and 30 random pools; re‑audit failure items within 48 hours.
-
Communication templates
Customer apology + remediation ETA; staff memo about immediate action items and expectations.
Safety & regulatory references (informational; consult counsel)
Reference links for safety and regulatory guidance — informational only; consult counsel for jurisdictional requirements.
-
OSHA — Hazard Communication Standard (HCS)
https://www.osha.gov/hazcom
-
OSHA — PPE guidance
https://www.osha.gov/personal-protective-equipment
-
CDC — Model Aquatic Health Code (MAHC)
https://www.cdc.gov/mahc/
-
Note
Always review local/regional pool health codes and consult legal counsel or local authority for jurisdictional requirements. This is informational and not legal advice.
Internal links to the Splshly content cluster (use these to build the KB)
Use these internal links to expand SOPs into deeper KB articles, templates and checklists.
-
KPI dashboard & metric calculations
/blog/which-kpis-actually-move-a-pool-service-business-dashboard-blueprint
-
Chemical handling & mobile SOPs
/blog/prevent-chemical-incidents-mobile-sop-for-safe-storage-transport
-
Photo shot lists & dispute reduction
/blog/stop-disputes-and-boost-repair-approvals-mandatory-photo-shot-lists
-
Routing rules & batching heuristics
/blog/route-planning-rules-for-mixed-residentialcommercial-pool-territories
-
Truck stocking, PARs & kitting
/blog/reduce-wasted-trips-tiered-truck-stocking-plan-and-seasonal-pars
-
Parts procurement & vendor SLA
/blog/don-t-lose-jobs-to-parts-delays-a-procurement-playbook-for-pool-parts
-
Inventory coordination
/blog/coordinate-warehouse-trucks-and-vendors-an-integrated-inventory
-
Microtraining & KB building
/blog/build-a-living-pool-technician-knowledge-base-microtraining-modules
-
QA enforcement & process maps
/blog/avoid-inconsistent-service-build-maintenance-workflows-and-qa-checks
-
Quote-to-cash & billing playbooks
/blog/pool-service-quote-to-cash-playbook-map-estimates-parts-holds-dispatch
-
Preventive maintenance triggers
/blog/don-t-wait-for-breakdowns-equipment-specific-preventive-maintenance
Third‑party sources and benchmarks (for configuring thresholds)
Third‑party benchmark links to use as starting points for KPI targets; tune to your data and region.
-
Field‑service KPI guides (industry context)
NetSuite — Field Service KPIs & Metrics: https://www.netsuite.com/portal/resource/articles/erp/field-services-kpis-metrics.shtml
-
Benchmarks & KPI explanations
FieldEdge — Field Service KPIs: https://fieldedge.com/blog/field-service-kpis/
-
Statistical sampling context
standard binomial sampling rationale (see QA sampling formula above).
-
Use third‑party benchmarks only as starting points — tune targets to your data and region.
How we measured — baseline metrics to collect before hiring
Events and baseline metrics to instrument in your FSM/mobile app before ramping hires.
-
Per‑job events to capture in FSM/mobile app
jobcreated, jobdispatched, techarrived, servicestart, serviceend, photosuploaded (tagged), chemicaltests (values), partsused (SKU & qty), followuprequired (Y/N), customerconfirmationsent.
-
Baseline metrics to record for 2–4 weeks
avg job minutes by pool type, avg drive minutes per tech/day, chemical cost per pool/week, current revisit rate (48h), current FTFR, churn (90‑day).
-
Instrumentation notes
Tag problem pools with "problem_pool" label; keep time‑stamped photos and test result entries for auditability.
Multimedia & assets to create (priority)
Priority multimedia assets and placeholder URLs to host on your CDN.
-
KPI dashboard mockup (PNG) — placeholder
https://splshly.com/media/dashboard-mockup.png
-
6‑month milestone timeline image — placeholder
https://splshly.com/media/6mo-timeline.png
-
Sample audit form screenshot — placeholder
https://splshly.com/media/audit-form.png
-
Printable chemical dosing quick card — placeholder
https://splshly.com/media/chemical-quick-card.pdf
-
Host assets on your CDN and replace placeholders with stable short URLs above.
Applying templates into your tools (quick path)
Quick steps for applying the SOP and onboarding templates into common tools (Trainual / Notion / FSM / Routing).
-
Trainual / Notion / LMS
1) Copy SOP template into a new module and replace placeholders. 2) Attach audit form and required photos as assets. 3) Assign module to new hire cohorts with due dates and assessments.
-
FSM / Routing
Import CSV with customer metadata and PAR SKUs; map fields to job types and required checklists.
-
Suggested example vendors (examples only; not endorsements)
FSM: ServiceTitan, Jobber. KB/LMS: Trainual, Notion. Routing optimizer: Route4Me, built‑in FSM routing (if included). Mark these as examples — select vendors by API, offline support, and checklist capability.
Appendix A — audit sample size worked example
Worked example for binomial no‑defect sampling to detect a defect rate of p0 with confidence (1 − α).
To detect a defect rate p0 = 0.10 (10%) with 95% confidence: n = ln(0.05)/ln(1−0.10) ≈ 28.44 → round up to 29. Interpretation: with 29 audited jobs, if the true defect rate is 10% there's a 95% chance you'll find at least one defect.
Appendix B — example headcount sensitivity (illustrative)
Illustrative headcount sensitivity using totalpools = 2,250 and different targetpoolspertech values.
| total_pools | target_pools_per_tech | required_techs |
|---|---|---|
| 2,250 | 75 | 30 |
| 2,250 | 60 | 38 (8 additional hires vs 75) |
| 2,250 | 85 | 27 |
Use the downloadable spreadsheet to enter your own totals and see the impact on hires, revenue, and margin.
Call to action
Download the full kit (SOP templates, 6‑month checklist, audit form, financial model): https://splshly.com/kit/scale-playbook-6mo.pdf
Need this templated into your Trainual or Notion? See the “apply template” guide in the kit for step‑by‑step copy instructions and two example vendor flows.
Legal & editorial notes
Safety/regulatory links above are informational. Consult local authorities or counsel for jurisdictional compliance; Splshly does not provide legal advice. Templates are generic and contain placeholders; do not include PII before sharing publicly. Author/reviewer/last‑updated metadata present at top — do not publish without Ops/QA and Content confirmation of attachments and numbers.
If you want, I can: 1) Export the 6‑month checklist into a printable PDF and a CSV roster for your recruiting pipeline (fill in your targets), or 2) Customize the targetpoolsper_tech and revenue assumptions and show the exact hiring timeline and break‑even math for your current book of business. Which would you like next?
Ready to elevate your pool service business?
Join hundreds of pool service professionals using Splshly to save time, optimize routes, and enhance customer satisfaction.