



Setting a monthly rate for recurring pool service is a different math problem than quoting a repair. A repair has a defined scope, a parts list, a start and an end. A recurring maintenance account is an open-ended promise — you're committing to show up week after week, absorb chemical swings, eat drive time, and carry that customer through the shoulder seasons when the water still needs attention but nobody's swimming. Price it wrong on a one-off repair and you lose a little on one job. Price a recurring account wrong and you lose that same amount every single month, silently, for years.
Most pricing frameworks in this industry hand you the five buckets — labor, vehicles, chemicals, overhead, profit — and then give you a form to fill in. That's the right structure. The problem is the form is where everything falls apart, because the buckets overlap, the denominators get fuzzy, and the difference between markup and margin quietly eats a chunk of the profit you thought you were adding.
This page gives you the whole thing: a transparent calculation framework, a worked methodology, two fully worked fictional examples, a service-scope checklist, an annual-review checklist, and a spreadsheet layout you can rebuild in any tool you already own. It does not tell you what to charge. It can't — your costs, your routes, and your market are yours. What it does is make sure that when you land on a number, you actually know where it came from.
Purpose, scope, and who should use this
This worksheet is built for one specific pricing decision: recurring monthly residential or commercial pool maintenance. That means the accounts where you show up on a schedule, test and balance water, keep the equipment running, and bill on a repeating cycle.
-
Repair estimates (different scope, different parts-driven math)
-
Construction or remodel bids
-
One-time green-to-clean cleanups
-
An "industry price list" — there is no such thing here, and you shouldn't want one
Who this is for: owners and operators setting new recurring rates, managers reviewing an existing book that hasn't been repriced in years, and technicians moving into a lead or route-management role who finally need to understand why the number on the invoice is what it is.
If you're building repair pricing, that's a genuinely different exercise — scope-defined, parts-heavy, and estimated per job rather than allocated across a route. This worksheet won't serve that decision well, and forcing recurring-service logic onto a repair quote is one of the more common ways operators end up underquoting fixes.
Read this first: independent pricing and competition-law notice
Before you touch a single number, understand this clearly: the price you set is your decision, based on your costs and your business goals — and it must stay that way.
Eliminate missed appointments and dispatch delays.
Splshly ensures every pool service is scheduled, tracked, and completed efficiently.
- Unified scheduling dashboard
- Automated customer reminders
- Technician route optimization
No credit card required
-
Use this worksheet with your own numbers only. Your wages, your fuel, your overhead, your desired return.
-
Do not share your prices, margins, or planned rate changes with a competitor, and don't ask for theirs — not at the association meeting, not in the trade Facebook group, not in a "hey, what are you guys charging for weeklies?" text.
-
Talking to a customer about your price is normal business. Talking to a competitor about pricing is where the risk lives.
This notice is a general summary of publicly available government guidance, not legal advice. If you have any doubt about a specific situation — an association discussion, a joint bid, an acquisition conversation — talk to a qualified antitrust attorney before you talk to anyone else.
> A note on this asset's review status: The competition-law language above summarizes publicly available FTC and DOJ guidance. It has not been reviewed by an outside attorney retained for this page. Where these decisions carry real risk for your business, treat the cited government sources as your primary reference and get your own counsel.
Before you start: input-gathering checklist
Half the reason pricing worksheets produce garbage is that people fill them in from memory. Pull the actual documents first. Print this and gather everything before you open the calculator.
-
[ ] Billing period — monthly, 4-week cycle, or seasonal? Pick one and stay consistent.
-
[ ] Service tier being priced — basic chem check, full service, chem-inclusive, commercial, etc. Price one tier at a time.
-
[ ] Number of pools/accounts served on the route or book you're pricing
-
[ ] Expected service visits per month per account (4 weekly, 2 biweekly, etc.)
-
[ ] Labor hours per visit — actual on-site time, measured, not guessed
-
[ ] Chemicals included vs. billed separately in the agreement
-
[ ] Vehicle allocation method you'll use — by route hours, by miles, by visits, or another documented basis
-
[ ] Overhead allocation method — how you'll spread office, admin, software, and insurance across accounts
-
[ ] Payroll documents — wage rates, most recent payroll-tax filings, workers' comp policy rate, benefits costs
-
[ ] Vehicle records — lease/payment, insurance premium, last 3–6 months of fuel and maintenance
-
[ ] Your desired return — as a markup or a target margin (you'll see the difference below)
Pull the actual documents first.
If any of these are estimates, mark them as estimates. The worksheet will still run, but you'll know which outputs are soft.
The five modules, defined with units
Every number below has a unit and an allocation basis. That's the whole game. When people say a pricing form "didn't work," what actually happened is that they mixed a per-visit number with a per-month number, or double-counted a cost that was already inside another bucket. Units first, always.
Module 1 — Fully burdened field labor (unit: cost per labor hour)
Your technician's wage is not your labor cost. The burdened cost is what you actually spend to put a person on-site for an hour, and it always runs higher than the base wage.
-
Base hourly wage (or an assumed hourly value for owner labor)
-
Employer payroll taxes. In the U.S., employers generally owe the employer share of Social Security and Medicare (FICA) plus federal and state unemployment tax (FUTA/SUTA). Rates, wage bases, and state obligations differ, so pull your own current figures from IRS Publication 15 (Circular E), Employer's Tax Guide.
-
Workers' compensation premium (rate depends on your state and class code)
-
Benefits you actually pay (health contribution, retirement match, etc.)
-
Paid nonproductive time — PTO, holidays, training, drive time you don't bill
Formula:
``
Fully burdened labor cost per hour =
  (Annual base wage + payroll taxes + workers' comp + benefits + paid nonproductive time cost)
  ÷ Annual productive (billable) hours
``
The denominator matters as much as the numerator. If you divide by 2,080 (all paid hours) instead of your actual productive hours, you'll understate your true cost per productive hour.
Module 2 — Vehicle and route cost (unit: your choice — per route hour, per mile, or per visit)
Add up your monthly vehicle costs, then pick one documented allocation basis and stick with it.
-
Lease or loan payment (if applicable)
-
Commercial auto insurance
-
Fuel
-
Maintenance and tires
-
Registration and any inspection/permit fees
Then allocate. If a truck runs one route serving 45 accounts, you can spread monthly vehicle cost across 45 accounts, or across route hours, or across miles. Document which basis you chose — the worksheet requires it, because switching basis mid-calculation is a classic silent error.
``
Vehicle cost per account per month =
  Total monthly vehicle cost ÷ Accounts served by that vehicle per month
``
(Substitute route hours or miles in the denominator if you allocate that way instead.)
Module 3 — Chemicals and consumables (unit: per visit or per account per month)
Keep two things separate, because they behave differently:
-
Chemicals — chlorine, acid, stabilizer, algaecide, etc.
-
Non-chemical consumables — DE, filter cartridges you replace on schedule, test reagents, small items
The single most important decision here: are chemicals included in the service agreement, or billed separately? If included, they go into your cost stack. If billed separately, they don't belong in the recurring rate at all — putting them there is a double-count that inflates your cost and makes you look uncompetitive against your own numbers.
``
Chemical cost per account per month =
  Chemical cost per visit × Visits per month
``
Module 4 — Overhead (unit: allocated per account per month)
Overhead is everything that keeps the business running but isn't already captured in labor or vehicle costs:
-
Office/yard rent
-
Admin and office staff wages not already in your field-labor module
-
Software, phones, internet
-
General liability insurance
-
Accounting, legal, licensing
-
Marketing
Pick an allocation basis — most operators divide total monthly overhead by total active accounts — and watch for double-counting. The most common overlap: an owner who pays themselves through field labor and takes an owner's draw booked as overhead, counting the same person twice. Another one: insurance that's already sitting in the vehicle module getting re-added to overhead.
``
Overhead per account per month =
  Total monthly overhead ÷ Total active accounts
``
Module 5 — Capacity and utilization (the module people skip, and shouldn't)
This one quietly determines everything. Your cost per account is only as good as your assumption about how many accounts a tech can actually service.
There are paid hours, and there are billable field hours. Drive time, restocking, callbacks, admin, weather days, and no-access visits all eat into billable time. If you assume a tech services 50 accounts a week when the route realistically supports 42, every per-account cost you calculated is understated — and you'll price the whole book too low.
``
Available billable field hours per month =
  Paid field hours per month − nonbillable time (drive, restock, admin, weather, callbacks)

Practical account capacity =
  Available billable field hours ÷ Labor hours per account per month
``
The insight most operators miss: capacity is a cost multiplier, not a scheduling detail. Overstate it by 15% and you don't just strain your crew — you've baked a 15% error into the denominator of your cost per account.
Total cost, cost per account, and then the part everyone gets wrong
Once the modules are built, the cost side is simple addition:
``
Total monthly operating cost =
  Burdened labor cost + vehicle cost + chemical/consumable cost + overhead
  (all expressed per month for the book or route being priced)

Cost per account per month =
  Total monthly operating cost ÷ Number of active accounts
``
Now you add your profit. And this is where a lot of money leaks — because markup and margin are not the same thing, and they never will be.
Markup vs. margin — the difference that costs you money
-
Markup is a percentage added on top of your cost.
Price = Cost × (1 + markup %) -
Margin is profit as a percentage of the final price.
Price = Cost ÷ (1 − margin %)
They produce different prices from the same cost. Watch: Say your cost per account is $100.
The calculator produces four labeled outputs, always:
| Output | What it means |
|---|---|
| Total monthly operating cost | Full cost to serve the book/route per month |
| Cost per account per month | Operating cost ÷ active accounts |
| Price at selected markup | Cost × (1 + markup %) |
| Price at target margin | Cost ÷ (1 − margin %) |
Now read the example: Apply a 30% markup vs a 30% margin to a $100 cost and see the difference.
Worked example 1 — markup target (fictional)
Fictional inputs. These are illustrative numbers to test the math, not recommended prices or benchmarks.
-
Accounts on route
40
-
Visits per month per account
4
-
Burdened labor
$38/productive hour, 0.5 hr per visit → 0.5 × 4 × 40 = 80 hrs/mo → 80 × $38 = $3,040/mo
-
Vehicle cost
$1,100/mo total, allocated across 40 accounts
-
Chemicals (included)
$9/visit × 4 × 40 = $1,440/mo
-
Overhead allocated
$22/account × 40 = $880/mo
Total monthly operating cost: $3,040 + $1,100 + $1,440 + $880 = $6,460 Cost per account per month: $6,460 ÷ 40 = $161.50
Apply a 35% markup:
$161.50 × 1.35 = $218.03 per account per month
Worked example 2 — target margin (fictional)
Same fictional route, same $161.50 cost per account. This time the operator wants a 35% margin instead of a 35% markup:
$161.50 ÷ (1 − 0.35) = $248.46 per account per month
The comparison that matters: identical cost, identical "35%," two prices — $218.03 vs. $248.46. A $30.46 per-account-per-month gap. Across 40 accounts that's about $1,218/month, or roughly $14,600/year, from a single misread of one word. Multiply that across a multi-route book and you can see how businesses quietly run years below their intended profitability without ever finding a "mistake" on any invoice.
Scenario comparison
Build at least three scenarios so you can see how a change in scope or route conditions moves your cost — not to compare against anyone else's prices, only against your own inputs.
| Scenario (fictional) | Labor/mo | Vehicle/mo | Chem/mo | Overhead/mo | Total cost | Cost/account (40) |
|---|---|---|---|---|---|---|
| Standard weekly | $3,040 | $1,100 | $1,440 | $880 | $6,460 | $161.50 |
| Chemical-inclusive (heavier dosing) | $3,040 | $1,100 | $2,160 | $880 | $7,180 | $179.50 |
| Longer-drive route (+25% drive time) | $3,420 | $1,375 | $1,440 | $880 | $7,115 | $177.88 |
Worth internalizing: drive time and chemical scope move your floor as much as wages do. A route that looks identical on paper can cost $18/account/month more purely because the stops are spread out. If your pricing doesn't distinguish a tight route from a scattered one, the tight routes are subsidizing the scattered ones.
Building the spreadsheet yourself (transparent formulas, no download wall)
Rather than gate a file behind an email form, here's the complete layout so you can rebuild it in Excel, Google Sheets, or anything else you already use. Every formula matches the examples above.
Tab 1 — Inputs
| Cell label | Example value | Unit |
|---|---|---|
| B2 Base wage/hr | 24 | $/hr |
| B3 Burden multiplier or added costs | (build from Module 1) | — |
| B4 Burdened labor/hr | 38 | $/hr |
| B5 Labor hrs per visit | 0.5 | hrs |
| B6 Visits per month | 4 | count |
| B7 Accounts | 40 | count |
| B8 Vehicle cost/mo | 1100 | $/mo |
| B9 Chem cost/visit | 9 | $/visit |
| B10 Overhead/account/mo | 22 | $/account |
| B11 Markup % | 0.35 | % |
| B12 Margin % | 0.35 | % |
Tab 2 — Calculations
``
Labor/mo          = B4  B5  B6  B7
Vehicle/mo        = B8
Chem/mo           = B9  B6  B7
Overhead/mo       = B10  B7
Total cost/mo     = SUM(labor, vehicle, chem, overhead)
Cost/account/mo   = Total cost / B7
Price (markup)    = Cost/account * (1 + B11)
Price (margin)    = Cost/account / (1 - B12)
``
Safeguard formulas — build these in, they save you from silent errors:
``
Accounts guard:   =IF(B7<=0, "ERROR: accounts must be > 0", ...)
Margin guard:     =IF(B12>=1, "ERROR: margin cannot be 100%+", ...)
Negative guard:   =IF(OR(B4<0,B8<0,B9<0,B10<0), "ERROR: negative cost input", ...)
Blank guard:      =IF(COUNTBLANK(B4:B10)>0, "WARNING: missing inputs", ...)
``
-
Is owner labor in the labor module and in overhead? (Pick one.)
-
Is insurance in both the vehicle module and overhead?
-
Are separately-billed chemicals sitting inside the recurring cost stack?
-
Is any admin wage counted in both burdened labor and overhead?
Formula validation record: Both worked examples above were checked by hand and by rebuilding the formulas in a spreadsheet. Example 1 returns $161.50 cost/account and $218.03 at 35% markup. Example 2 returns $248.46 at 35% margin. The web-calculator logic and the spreadsheet formulas use identical expressions, so identical inputs return identical outputs. If you rebuild it and get different numbers, check your denominator (accounts vs. hours) first — that's where mismatches almost always live.
Service-scope and contract checklist (define this before you price)
Price follows scope. If the scope is vague, the price is a guess, and every ambiguity becomes a free service you didn't mean to give away. Nail down at least these before you commit a number to an agreement:
-
Visit frequency — weekly, biweekly, twice weekly, seasonal changes
-
Water testing — which parameters, how often, and recorded how
-
Chemical balancing — included, and to what standard
-
Chemical inclusions/exclusions — exactly which chemicals are in the rate vs. billed
-
Filter cleaning — frequency, cartridge vs. DE vs. sand, and whether it's included or extra
-
Skimming/brushing/vacuuming — what's standard each visit
-
Minor maintenance — o-rings, small parts, basket replacement — included up to what threshold?
-
Repair exclusions — explicitly state repairs are quoted separately (this is your firewall against scope creep)
-
Weather/access assumptions — locked gates, dogs, no-access visits: do you still charge?
-
Equipment run responsibilities — timers, automation, who adjusts what
-
Billing and payment terms — due date, autopay, late handling, seasonal billing structure
-
Price-review triggers — the conditions under which the rate changes (see next section), written into the agreement so a future increase isn't a surprise
That repair-exclusion line (#8) is the one operators most often leave fuzzy, and it's the one that turns a maintenance account into an unpaid handyman relationship.
Annual review workflow: when to rerun the model
Recurring pricing rots quietly. Nothing dramatic happens — costs drift up a few dollars at a time while your rate sits still, and one day the route that used to make money is barely breaking even. Rerun the whole model at least annually, and immediately any time one of these triggers fires:
-
Wage changes — you raised pay, or the market forced you to
-
Insurance renewal — auto, general liability, or workers' comp premium moved
-
Fuel or chemical cost shifts — sustained changes, not one bad week
-
Route changes — added stops, lost density, longer drives, territory shifts
-
Service-scope changes — you started including something you used to bill
-
Capacity changes — a tech's realistic account load went up or down
Add a seventh in practice: when you add or lose enough accounts to change your overhead-per-account math. Overhead spread across 260 accounts costs less per account than the same overhead across 180 — a shrinking book raises your per-account cost even if you change nothing else.
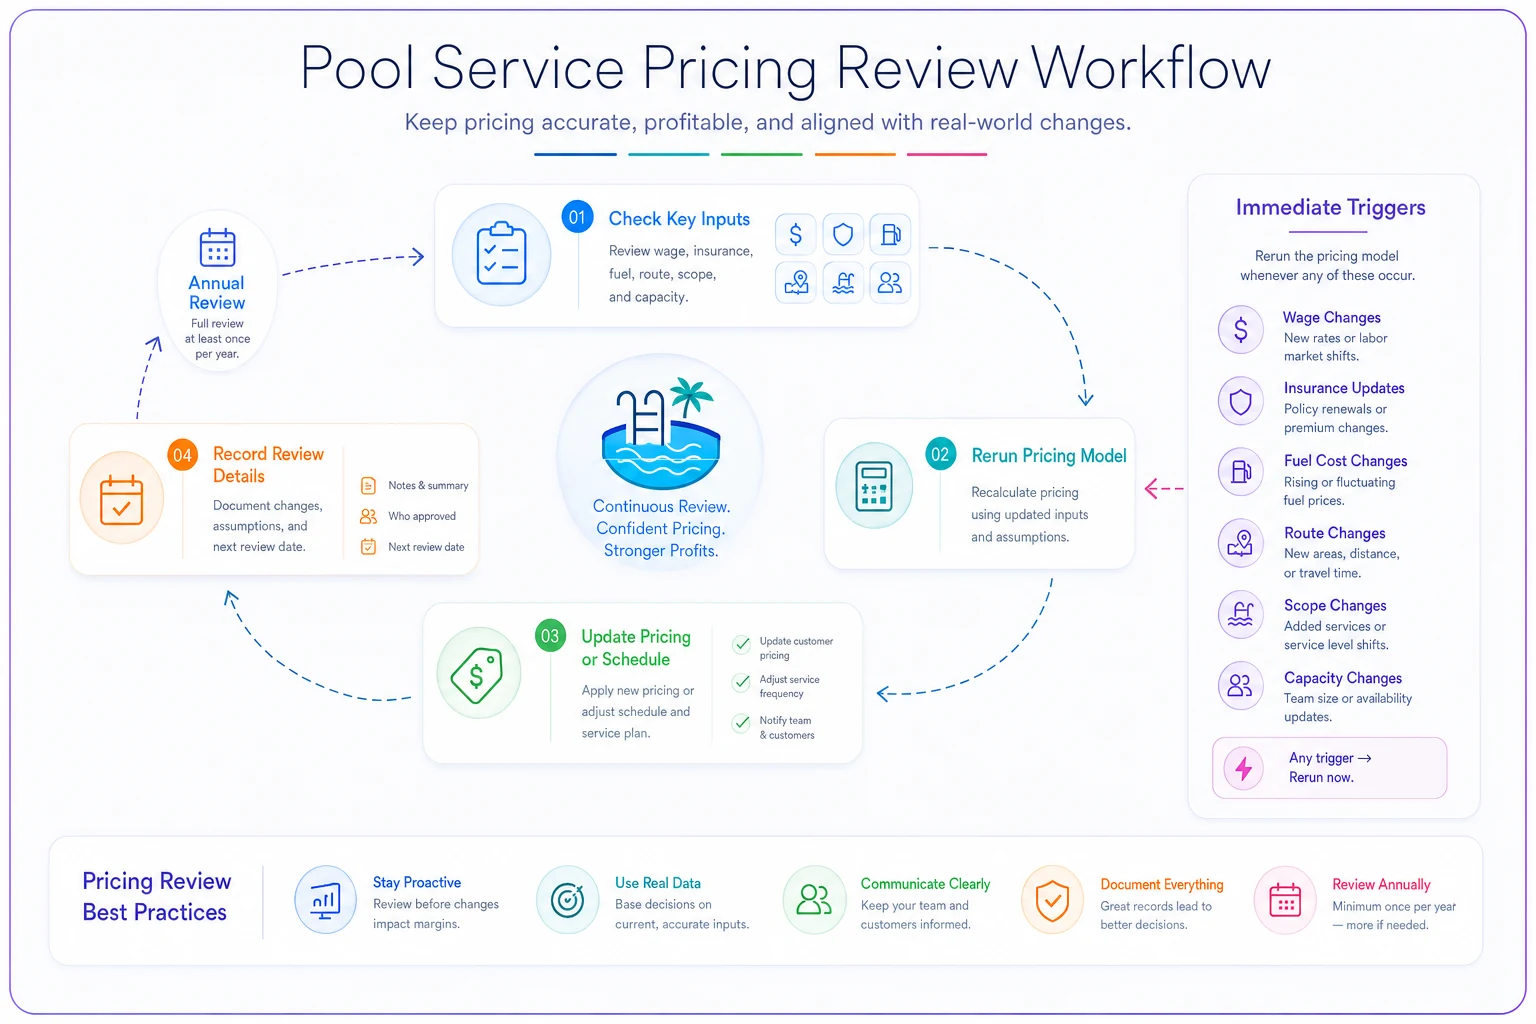
The operators who hold margin through inflation aren't the ones who guess well. They're the ones who rerun this model on a schedule and reprice from current numbers instead of last year's memory. Tying rate reviews to these triggers is exactly the kind of thing worth building into your operating cadence rather than leaving to whenever someone remembers — the same way you'd systematize KPI thresholds or scheduling rules so they actually get acted on instead of admired once and forgotten.
A realistic scenario
Consider a fictional mid-size residential operator running about 3 routes and somewhere around 130 accounts. They'd priced most of that book three years earlier and never repriced — new accounts got quoted "about the same as the last one," which meant the whole book slowly anchored to an outdated cost basis.
When they rebuilt from actual current numbers, two things surfaced. First, their burdened labor had been calculated on the old wage and divided by paid hours, not productive hours — understating real labor cost per account by a meaningful chunk. Second, they'd been applying what they called a "35% profit" that was actually a 35% markup, when they'd always intended a margin.
Fixing the capacity denominator and correcting the markup/margin mix-up moved their intended per-account price up by roughly $25–$30 on a large slice of the book. They didn't jack up every account overnight — they phased it in on renewals and new accounts with a written price-review clause. The revenue lift over the following year landed somewhere in the low five figures, none of it from new customers, all of it from pricing the existing book against reality. Nothing exotic. Just running the actual math instead of trusting a number set three years earlier.
When this worksheet makes sense — and when it doesn't
Use it when:
-
You're setting a new recurring rate and want to know your real floor
-
You're reviewing a book that hasn't been repriced in a year or more
-
You suspect certain routes or account types are unprofitable but can't prove it
-
You're standardizing pricing across techs so quotes stop varying by whoever's talking
It's the wrong tool when:
-
You're quoting a repair or a one-time cleanup (scope-defined, parts-driven — different math entirely)
-
You're bidding new construction
-
You're hoping it'll tell you the "market rate" — it won't, and any tool that claims to is selling you a number, not a method
Who should not lean on this alone: if your business has complex payroll, multi-state operations, unusual entity structures, or contract obligations you're unsure about, treat the worksheet as a planning input and have a CPA or attorney review the pieces that carry real risk. The math is transparent on purpose so a professional can check it — not so you can skip the professional.
Limitations and professional advice
This is a planning framework that runs on your inputs. It does not, and cannot, tell you the "right," "fair," or "market" price for pool service in your area. Different states, cities, and situations carry different taxes, insurance requirements, labor rules, and contract obligations, and those differences can materially change your real costs.
The outputs are only as good as what you enter. Garbage denominators produce confident, wrong prices. Nothing here is tax, legal, insurance, employment, or accounting advice for your specific business — a qualified accountant, tax professional, attorney, or insurance adviser should review anything that affects your obligations or exposure.
The worked examples are fictional, built to validate the formulas. They are not benchmarks, not customer results, and not savings claims.
Methodology, version, and corrections
What this asset is: a vendor-neutral framework and calculator for building a recurring monthly pool-service price from an operator's own labor, vehicle, chemical, overhead, capacity, and profit inputs.
Inputs, units, and formulas are disclosed in full in the module sections and the spreadsheet layout above. Rounding in the worked examples is to the nearest cent for prices and two decimals for per-account costs. No hidden assumptions: every denominator (accounts, hours, visits, miles) is stated where it's used.
Validation: two fictional test cases (Example 1, markup; Example 2, margin) are published above with full inputs and outputs. Hand calculation and spreadsheet rebuild return identical results for both.
-
IRS Publication 15 (Circular E), Employer's Tax Guide (accessed 2025)
Review status (stated honestly): The formulas and examples were validated by hand and by spreadsheet. The competition-law summary reflects publicly available FTC and DOJ guidance. This page has not been independently reviewed by an outside CPA or antitrust attorney retained for it; where these areas carry real risk for your business, rely on the cited primary sources and your own professional advisers rather than on this summary.
Version: 1.0 Published: 2025 Last reviewed: 2025 Changelog: v1.0 — initial publication. Modules, formulas, two validated fictional examples, service-scope checklist (12 items), annual-review triggers, and independent-pricing notice. Future formula changes or material corrections will be logged here with date. Corrections: if you find a formula error or an unclear unit, that's exactly the kind of thing worth flagging so the framework stays trustworthy — send it through the site's contact route and it'll be logged in the changelog.
Recurring pricing isn't a number you set once. It's a model you maintain — the same discipline you'd apply to routes, truck stock, or scheduling. The operators who protect their margins over years aren't guessing better than everyone else. They're just running the actual math from current inputs, on a schedule, and refusing to let a three-year-old assumption keep quietly deciding what they earn.
Ready to elevate your pool service business?
Join hundreds of pool service professionals using Splshly to save time, optimize routes, and enhance customer satisfaction.