


Version: 1.0 (Pilot Framework Edition) Publication date: For the 2026 peak-season planning cycle Reporting scope: U.S. pool-service operations Report owner: Splshly Operations Research Update policy: This framework is revised when a permissioned, valid dataset of sufficient size becomes available. Until then, it is published as a methodology and operator-benchmarking framework, not as a completed statistical benchmark.
A necessary disclosure before you read a single number
Most "industry benchmark" reports floating around pool-service circles have a quiet problem: they publish thresholds without telling you where the numbers came from, how they were calculated, or whether the sample even resembles your business.
This report is built to be the opposite of that.
At the time of publication, Splshly has not completed a permissioned, anonymized, statistically valid benchmark dataset large enough to publish real distribution statistics — medians, percentile ranges, or "typical" route-capacity figures — that would fairly represent U.S. pool-service operators. We're not going to invent those numbers to make this document look more impressive. Fabricated benchmarks are worse than no benchmarks, because they get quoted, compared against, and quietly push operators into decisions the data never actually supported.
So what is this?
-
It's a transparent benchmarking framework — the exact metric definitions, calculation rules, data-governance approach, and signal-to-action logic that a credible pool-service benchmark must use, published in full so that:
-
Any operator can start measuring their own route-capacity, repeat-visit, and truck-stock signals today, using the worksheets included below, without buying anything. When a valid permissioned dataset is completed, the published numbers will drop into a structure you can already audit.
If that trade — real methodology now, real numbers when they're actually valid — is useful to you, keep reading. If you were hoping for a magic "you should complete 14 stops per tech per day" line, this isn't that report, and you should be skeptical of any report that gives you one without showing its work.
Executive summary
What this report covers. A framework for measuring peak-season operational stress across five domains: route capacity, repeat visits and first-time completion, truck-stock and parts readiness, route efficiency, and margin-protection signals.
Eliminate missed appointments and dispatch delays.
Splshly ensures every pool service is scheduled, tracked, and completed efficiently.
- Unified scheduling dashboard
- Automated customer reminders
- Technician route optimization
No credit card required
Geography and scope. U.S. pool-service operations, both residential and light-commercial service models.
Reporting period. This version publishes definitions and framework only. No reporting-period statistics are claimed because no valid permissioned dataset has been finalized for publication.
Sample definition. Not applicable in this version. When distribution statistics are published, they will disclose sample size, participating-business count, geographic coverage, service-model mix, and inclusion/exclusion criteria — or they will not be published.
The specific operational questions this report can help you answer:
-
Which measurable signals suggest a route is approaching or exceeding its sustainable capacity?
-
How should each signal be defined so two people in your company calculate it the same way?
-
What should an owner verify locally before reacting to a signal?
-
What non-proprietary operational response fits each signal?
The questions this report cannot answer (yet):
-
What the "average" or "optimal" number is for any metric across U.S. pool operators.
-
Whether your specific numbers are good or bad relative to a representative peer group.
-
Whether any software — including ours — causes fewer callbacks or higher margins. That's a causal claim, and we don't have causal evidence.
Major limitation, stated plainly: This is a definitions-and-decision framework, not a statistical benchmark. Treat every threshold you set using it as a hypothesis about your own operation, not an industry law.
Methodology and data governance
Even though this version publishes framework rather than finalized statistics, the governance rules are written now so that any future numbers are held to them.
What a valid dataset would have to include
For any published benchmark figure, the underlying records would be drawn from permissioned, anonymized operational data — either aggregated Splshly operational records where customers have consented to anonymized aggregation, or directly contributed operator records under explicit agreement. No scraping. No purchased lists. No "modeled" numbers dressed up as observations.
Inclusion and exclusion rules
-
Included Active U.S. pool-service accounts with recurring maintenance and/or repair work orders during the defined reporting window.
-
Excluded Test accounts, accounts with fewer than a minimum number of valid work orders in the window (to avoid single-truck noise distorting medians), and records missing the fields required to compute the metric in question.
-
Duplicate handling Work orders sharing the same job, site, and date signatures are deduplicated to a single record before any counting.
Metric definition discipline
Every published metric requires five things, no exceptions: a plain-language definition, a numerator, a denominator, a time window, and a stated treatment of canceled, rescheduled, incomplete, and duplicate work orders. If a metric can't be pinned down that precisely, it doesn't get published.
-
Missing data Records missing a required field are excluded from that metric only, not from the whole dataset. The valid-observation count is reported per metric, so you can see how much data actually stands behind each figure.
-
Outliers Extreme values are flagged and examined, not silently deleted. When trimming is applied, the rule (for example, trimming the top and bottom percentile band) is disclosed alongside the result.
Anonymization
No business name, address, technician name, or customer identifier appears in any aggregated output. Results are reported only at aggregate levels large enough that individual operators cannot be reverse-identified.
Conflicts of interest — disclosed
Splshly builds AI-assisted operational software for field-service businesses, including pool-service companies. That is a real conflict of interest for a report about pool-service operations, and pretending otherwise would be dishonest. Two guardrails apply: (1) this report makes no claim that Splshly improves any operational outcome, and (2) every metric and worksheet here is designed to be completed with a spreadsheet, a route sheet, and a parts log — no Splshly account required.
Review status — stated honestly
This framework has not yet undergone independent methodology review or formal pool-service-operator review for publication of statistical conclusions, because there are no statistical conclusions in this version to review. Before any benchmark numbers are published, the plan is: independent review by a data-methodology professional for the calculations, and review by an experienced pool-service operations leader for real-world plausibility of definitions and actions. Any safety, wage-and-hour, or chemical-handling guidance would additionally require review by an appropriate specialist. We will not imply that review occurred when it hasn't.
Peak-season capacity: the signals that actually mean something
Capacity in pool service isn't one number. It's the gap between what you planned to do and what actually got done, tracked over enough days that a single bad Tuesday doesn't fool you.
The most useful capacity indicators are the ones you can already pull from route sheets and work orders.
Planned-versus-completed visit ratio
-
Definition
Of the visits scheduled for a period, what share were completed as scheduled.
-
Calculation
Completed visits ÷ Planned visits, over a defined window (a rolling 7 or 14 days works well in-season).
-
Treatment rules
A visit rescheduled at customer request counts differently than one bumped because the route ran out of daylight — track those reasons separately, or the number lies to you.
Schedule spillover
-
Definition
Work that was scheduled for one day and pushed to a later day because the route couldn't absorb it.
-
Calculation
Spilled visits ÷ Planned visits for the day.
-
Why it matters
Spillover is often the earliest honest capacity signal. It shows up before overtime does, because a tech will quietly push two stops to tomorrow before they'll call in three hours late.
Technician hours and overtime share
-
Definition
Share of technician labor hours in the period that were overtime.
-
Calculation
Overtime hours ÷ Total technician hours.
-
Caveat
Overtime is governed by wage-and-hour rules that vary by state and by how workers are classified. This report does not provide wage-and-hour advice — if you're changing pay practices, that's a conversation for a qualified HR/employment professional in your state.
Route change rate
-
Definition
How often the day's actual route deviated from the planned route.
-
Calculation
Routes with material mid-day changes ÷ Total routes run.
-
Insight
A high route-change rate rarely means your techs are undisciplined. It usually means the plan was built without real drive-time or job-duration data, so reality overrides it every single day.
Uncompleted work
-
Definition
Work orders opened but not closed within their expected window.
-
Calculation
Open-past-window work orders ÷ Total work orders opened.
One pattern worth naming: operators tend to watch overtime because it's the line item that shows up on payroll. But spillover and uncompleted-work rates move first. Overtime is a lagging symptom. If you only watch the lagging signal, you're usually intervening a month late.
Repeat visits and first-time completion
This is the domain where sloppy definitions cause the most arguments. One dispatcher's "callback" is another's "return trip" is another's "scheduled follow-up." Before you benchmark anything, get these words nailed down.
-
Repeat visit Any additional visit to the same site for the same underlying issue within a defined window (commonly 14–30 days).
-
Callback A repeat visit triggered by the customer because a prior visit didn't resolve the issue — i.e., the customer had to call you back.
-
Return trip A repeat visit you initiated to finish work that couldn't be completed on the first visit (part not on truck, needs a second person, needs to drain, etc.).
-
Deferred repair Work correctly diagnosed and quoted but intentionally scheduled later. This is not a failure — but if you don't tag it, it pollutes your callback rate.
-
Incomplete work order A visit that occurred but did not close the job scope.
First-time completion rate
-
Definition
Share of jobs closed on the first visit without a callback or return trip.
-
Calculation
Jobs closed on first visit ÷ Total jobs.
-
Segmentation note
This should be segmented by work type (routine maintenance vs. repair) whenever the sample supports it, because a repair-heavy route and a maintenance-heavy route are not comparable. Where a segment is too small to be meaningful, it should be reported as "insufficient sample," not forced into a number.
The mistake that comes up repeatedly: operators lump deferred repairs and return trips into their callback rate and then panic that their quality is collapsing. It isn't — their tagging is broken. Clean tagging usually reveals that a good chunk of "callbacks" were actually planned second visits, which is a scheduling and parts story, not a technician-quality story.
Truck stock and parts readiness
You can't measure "did we have the part" directly across a whole operation without a clean inventory feed most companies don't have. So the honest approach is a proxy: measure the consequence of not having the part.
Parts-delay incidence (the proxy)
-
Definition
Share of jobs delayed, revisited, or left incomplete specifically because a required part was not on the truck or not available.
-
Calculation
Part-blocked jobs ÷ Total jobs requiring parts.
-
Data source in the field
This depends on your techs tagging why a job didn't close. If the reason code isn't captured at the moment of the visit, the metric can't be trusted — reconstructed-from-memory reasons are notoriously wrong.
Two very different categories need to be kept separate:
-
Stocked consumables (o-rings, common cartridges, DE, tablets, standard fittings): a stockout here is a replenishment/PAR problem. It should almost never block a job.
-
Ordered repair parts (pumps, motors, boards, specialty valves)
"not on truck" here is often correct and expected — you're not going to stock every board. For these, the meaningful metric is procurement lead time and whether the return trip was scheduled efficiently, not whether the part was on the van.
Split consumables and ordered parts in your reporting first; most fixable stock issues show up on the consumables side.
Blurring these two is the most common truck-stock analysis error. If your parts-delay rate looks alarming, split it by category first. Most of the time the fixable portion is the consumables side, and the "repair part wasn't on the truck" portion is mostly the normal cost of doing repair work.
Route efficiency
Route data is the most seductive and the most easily abused. Drive-time and stop-count numbers look precise, but they're heavily context-dependent — a dense HOA cluster and a rural spread-out route are not the same job, and comparing their stop counts is meaningless.
| Measure | Definition | Honest constraint |
|---|---|---|
| Drive time per stop | Total drive minutes ÷ stops completed | Heavily geography-dependent; only comparable within similar territory types |
| Stop count per tech-day | Completed stops ÷ tech-days | Meaningless without job-type mix; a repair day ≠ a maintenance day |
| Route density proxy | Stops ÷ total route miles | A proxy only; doesn't capture time-on-site variation |
| Scheduled vs. actual duration | Actual job minutes ÷ scheduled minutes | Requires reliable time capture; manual entry drifts |
| Unproductive travel | Drive minutes with no revenue-generating stop attached (returns for parts, backtracking) | Often the single most actionable number, but hardest to capture cleanly |
Route density beats raw stop count every time. Two extra stops on a tight cluster cost you almost nothing. Two extra stops that scatter a tech across town can quietly erase the margin on the whole day through fuel, time, and the kind of stress that drives mistakes. When operators chase "more stops per tech" without watching density, they usually add revenue on paper and lose it in drive time and callbacks.
Unproductive travel — especially the backtrack-for-a-part trip — is where route efficiency and truck-stock readiness collide. A parts-delay problem often shows up as an unproductive-travel problem. That's why these domains need to be read together, not in isolation.
Margin-protection signals
This is where reports usually overreach, so read this carefully: operational signals are not financial outcomes. A rising overtime share or callback rate is a warning light, not a proven dollar loss. The relationship between them is real but depends on your pricing, wages, fuel, and mix — variables this framework does not claim to model.
This section deliberately does not publish cost figures or profit thresholds. It separates observed operational signals (which you can measure yourself) from financial outcomes (which require your own P&L to interpret).
-
Rising overtime share without a matching rise in completed revenue-generating visits.
-
Rising callback and return-trip rate (each unpaid revisit consumes labor and fuel you already spent once).
-
Rising unproductive travel.
-
Rising parts-delay incidence on consumables specifically.
-
Growing gap between scheduled and actual job duration (your pricing was built on the scheduled number).
If cost categories are ever published in a future version, it will only happen if participating operators contribute sufficiently comparable cost data — and it will be labeled clearly as such. Until then, connect these signals to your own numbers, or bring them to whoever handles your books. This report is not a pricing guide and not a profitability guarantee.
Operational signal-to-action table
Each action below is labeled by its evidence basis: [Framework logic] = general operational reasoning, [Definition-driven] = follows directly from the metric definitions in this report. No action here is claimed to be validated by a completed statistical dataset, because that dataset isn't published in this version.
| Warning signal | Definition | Verify locally before acting | Non-proprietary response | Basis |
|---|---|---|---|---|
| Rising schedule spillover | Planned visits pushed to a later day | Is it seasonal surge or a persistent pattern across weeks? | Route review; workload rebalancing across techs/days | [Definition-driven] |
| Overtime share climbing | OT hours ÷ total hours rising | Check wage/hour classification with a qualified pro first | Workload rebalancing; capacity add; not a DIY pay-rule change | [Framework logic] |
| Callback rate up | Customer-triggered repeat visits rising | Confirm tagging — are deferrals miscoded as callbacks? | Service-scope review; QA on first visits | [Definition-driven] |
| Return-trip rate up | You-initiated repeat visits rising | Split consumable vs. repair-part cause | Replenishment/PAR review for consumables | [Definition-driven] |
| Parts-delay incidence up (consumables) | Jobs blocked by missing stocked items | Confirm reason codes captured at the visit | Replenishment review; PAR adjustment | [Definition-driven] |
| Unproductive travel rising | Non-revenue drive time growing | Map the backtracks — parts? sequencing? | Route review; truck-stock review | [Framework logic] |
| Scheduled vs. actual duration gap widening | Jobs take longer than booked | Check if pricing/time standards are stale | Pricing review; time-standard review | [Framework logic] |
| Route change rate high | Daily plans overridden constantly | Was the plan built on real drive/job-time data? | Route review; planning-input review | [Framework logic] |
Each table row pairs a measurable signal with a simple verify-before-act checklist and an operational response that doesn't require proprietary tools.
How the signals connect: a process flow
The sequence below shows how operational signals typically chain together during peak season — and why reacting to the wrong one first leads to expensive decisions.
Planned route runs long ↓ Schedule spillover rises (earliest signal) ↓ Techs push stops to next day → route density drops ↓ Overtime climbs (lagging signal — already a month behind) ↓ Callbacks rise if first-visit quality drops under load ↓ Unproductive travel rises if parts backtracks compound the problem ↓ Margin pressure — shows up last, costs the most to fix at this stage
The flow above shows the typical sequence of signals in peak season.
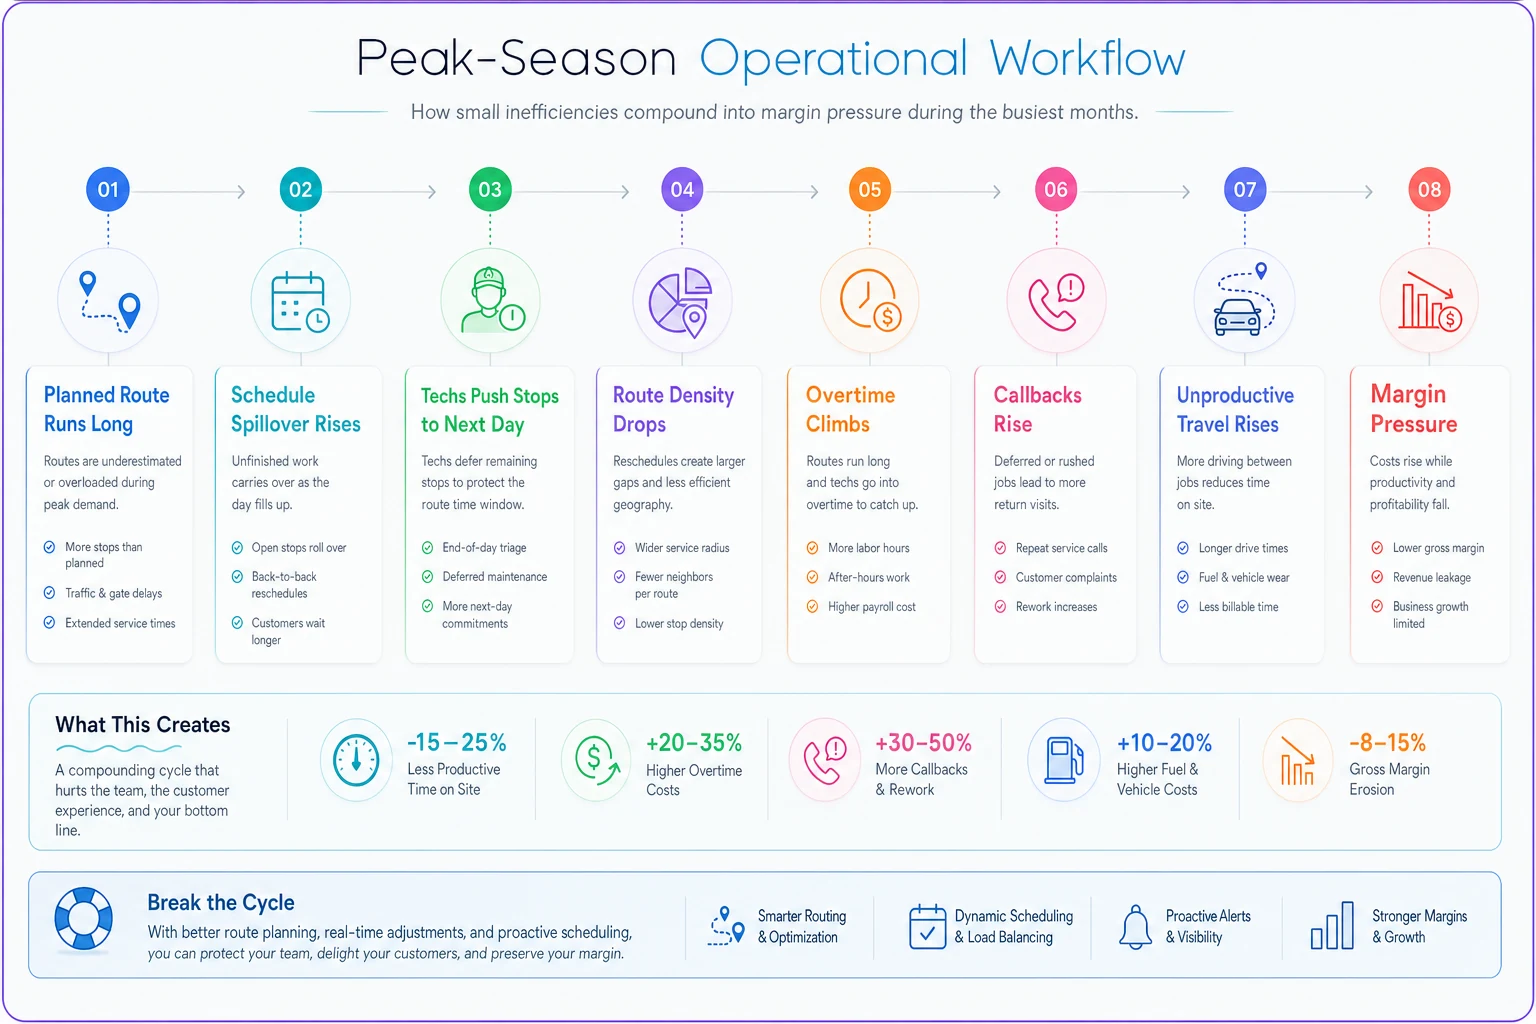
Reading the signals in order matters. Spillover and unproductive travel are where you have the most leverage. By the time overtime is climbing and callbacks are piling up, you've already lost most of the easy fixes.
Peak-season operations scorecard (printable — copy into a spreadsheet)
You do not need any software to use this. A whiteboard or a Google Sheet works. Fill it in weekly during peak season.
| Metric | Your current value | Data available? (Y/N) | Owner | Review cadence | Escalation trigger / action |
|---|---|---|---|---|---|
| Planned vs. completed visits | Weekly | ||||
| Schedule spillover rate | Weekly | ||||
| Overtime share | Weekly | ||||
| Route change rate | Weekly | ||||
| Uncompleted work rate | Weekly | ||||
| First-time completion rate | Weekly | ||||
| Callback rate | Weekly | ||||
| Return-trip rate | Weekly | ||||
| Deferred-repair count (tagged) | Weekly | ||||
| Parts-delay — consumables | Weekly | ||||
| Parts-delay — repair parts | Weekly | ||||
| Drive time per stop | Weekly | ||||
| Route density proxy | Weekly | ||||
| Unproductive travel | Weekly | ||||
| Scheduled vs. actual duration | Weekly |
How to use the "Data available?" column: If you write "N," that's not a failure — it's your most valuable output. A blank you can't fill in is a data-capture gap, and closing that gap (usually a reason-code field at job close) is often higher-leverage than any single metric.
Metric-definition worksheet
Use this to make sure everyone in your company calculates the same thing. Fill in the window and rules that fit your operation.
-
1. First-time completion rate - Numerator
jobs closed on first visit, no callback/return trip: - Denominator: total jobs in window: - Window: (e.g., rolling 14 days) - Rule: deferred repairs excluded from numerator failures? (Y/N):
-
2. Callback rate - Numerator
customer-triggered repeat visits, same issue: - Denominator: total jobs: - Window: - Rule: return trips (you-initiated) excluded? (Y/N):
-
3. Parts-delay incidence (split it) - Consumables
part-blocked jobs ÷ jobs needing consumables: - Repair parts: part-blocked jobs ÷ jobs needing ordered parts: - Window: - Rule: reason code captured at visit, not from memory? (Y/N):
-
4. Overtime share - Numerator
OT hours: - Denominator: total tech hours: - Window: _
-
5. Unproductive travel - Numerator
non-revenue drive minutes (backtracks, parts runs): - Denominator: total drive minutes: - Window: _
The discipline here matters more than the sophistication. A simple metric everyone calculates identically beats a fancy metric three people compute three different ways.
A realistic worked example (illustrative, not a benchmark finding)
This is a constructed illustration to show how the framework reads in practice. It is not data from the dataset, not a case study, and not a promised outcome. The numbers are hypothetical.
Picture a two-truck residential operation running roughly 320–360 maintenance and repair visits a month across a mixed suburban-and-semi-rural territory. Going into July, the owner notices overtime creeping up and assumes he needs to hire.
-
Overtime share
up, yes — but completed visits per tech-day flat.
-
Schedule spillover
elevated, mostly on the two most spread-out routes.
-
Callback rate
looks high — until tagging gets cleaned and about a third of "callbacks" turn out to be mislabeled deferred repairs.
-
Parts-delay, consumables
a handful per week, all o-rings and a common cartridge size.
-
Unproductive travel
concentrated on those same two spread-out routes, much of it parts backtracks.
The read: this isn't primarily a headcount problem. It's a route-density problem on two territories, a truck-stock PAR problem on a couple of consumables, and a tagging problem inflating the callback number. Rebalancing the two loose routes, bumping the PAR on two consumables, and fixing the callback tagging addresses most of the pain before adding a truck — a hire the raw overtime number alone would have wrongly justified.
The point isn't the specific numbers. It's the sequence: define, measure, split the signal, verify locally, then act. Reacting to the loudest number (overtime) would have produced the most expensive wrong answer (a premature hire).
Where operational software fits — and where it honestly doesn't
You can run this entire framework with a spreadsheet, and plenty of good operators do. The place tooling earns its keep isn't the math — it's capturing the reason codes and time data at the moment of the visit, which is exactly the data most manual processes lose.
The single hardest field to capture reliably is why a job didn't close on the first visit. That has to be logged at the truck, in the moment, or it gets reconstructed from memory and becomes worthless. AI-assisted operational platforms — Splshly among them — can reduce that friction by prompting for a reason code at job close, flagging routes where actual duration keeps beating scheduled duration, and surfacing spillover patterns before they show up on the payroll report. That's a data-capture and coordination benefit.
What we will not claim: that using Splshly, or any platform, causes fewer callbacks, lower overtime, or higher margins. We don't have causal evidence for that, and you should distrust any vendor who asserts it without a controlled study. Software makes the signals easier to see and act on. Whether your margins improve depends on what you do with those signals — which is entirely on the operator.
When this framework makes sense — and when it doesn't
When it's genuinely useful:
-
You run enough volume (multiple trucks, or one truck with heavy in-season load) that patterns exist to see.
-
You already capture, or can start capturing, job-close reason codes.
-
You want to make peak-season staffing and routing decisions on signals, not gut.
When it's overkill: A single owner-operator running 40 pools who already knows every callback by name. Track callbacks and parts-delays; skip the rest until you scale.
Who should be careful: Anyone tempted to treat a threshold they set as an industry standard. Your numbers are hypotheses about your business until you've watched them across a full season.
Limitations, representativeness, and responsible use
Read this section as seriously as the metrics.
-
This is not a universal standard. No number produced with this framework represents "the pool-service industry." It represents your operation, or a disclosed sample if statistics are later published.
-
This is not a pricing guide. Nothing here tells you what to charge. Duration-gap and margin signals are inputs to your pricing conversation, not answers.
-
This is not a profitability guarantee. Operational signals correlate with margin pressure; they don't guarantee any financial result.
-
This is not a safety, chemical-handling, or equipment manual. Any peak-season decisions touching heat exposure, chemical handling, or equipment safety should follow applicable authoritative guidance and qualified specialists — not this document.
-
This is not legal, tax, employment, or wage-and-hour advice. Overtime, worker classification, and heat-safety obligations vary by state and by your specific setup. Get qualified local guidance before changing pay or safety practices.
-
No representativeness is claimed. When numbers are published, they will come with sample size, participant count, geography, and inclusion rules — or they won't be published.
-
No causal claims about any software, including Splshly. Full stop.
Treat these limits as design constraints, not excuses to ignore measurement. The framework is intentionally conservative about claims; that conservatism is the point.
Methodology questions, corrections, and updates
If you spot a definitional error, want to challenge a calculation rule, or would consider contributing permissioned, anonymized operational data toward a future statistical version, that's exactly the kind of scrutiny this framework is built to invite. A benchmark that can't survive an operator saying "your callback definition is wrong for how I run" isn't worth publishing.
This document will be updated when — and only when — a valid, permissioned dataset and appropriate independent review support publishing real distribution statistics. Until that day, use the framework, fill in the scorecard, and hold every threshold you set as a question about your own operation rather than a rule handed down from an industry that, frankly, has been light on transparent numbers for a long time.
That transparency gap is the whole reason this exists. Start measuring. Define your terms. Split your signals before you act on them. That habit alone will put you ahead of most operations heading into peak season — with or without any software attached to it.
That transparency gap is the whole reason this exists. Start measuring. Define your terms. Split your signals before you act on them. That habit alone will put you ahead of most operations heading into peak season — with or without any software attached to it.
Ready to elevate your pool service business?
Join hundreds of pool service professionals using Splshly to save time, optimize routes, and enhance customer satisfaction.