



Report owner: Splshly Operations Research Research lead: Splshly operations analytics team Publication date: June 2026 Version: 1.0 (methodology-first snapshot) Next planned update: Seasonal refresh targeted for Q1 2027, contingent on sufficient validated data Data-source disclosure: This report is vendor-produced by Splshly. Read the full conflict-of-interest and limitations section before citing any figure.
Why this report exists, and what it deliberately does
Most operational advice in the pool-service trade falls into one of two buckets: generic "run a tighter ship" tips, or vendor pages that quietly assume the software already solved your problem. Neither one helps a service manager in March who needs to know whether their crew can actually absorb the June spike — or whether the same three repair types keep dragging techs back to the same addresses.
What's missing is a shared, defined way to measure the constraints owners already feel. When someone says "our first-time-fix rate is fine," what actually counts as a fix? Does a planned equipment swap booked on the first visit count as a return trip? If a tech runs back because a part wasn't on the truck, is that a stockout — or a routing miss?
This report tries to nail down those definitions first, then show what a transparent operational benchmark would report given properly structured data. One thing upfront: this is a methodology-first snapshot, not a large-sample industry census. Where there isn't enough validated data to publish a defensible percentage, we say so instead of inventing one. A benchmark you can't reproduce from a published data dictionary isn't a benchmark — it's a marketing number wearing a lab coat.
If you run pool service, the useful part is the framework itself: the metric definitions, classification rules, decision guide, and the worksheet at the end. You can apply all of it to your own job records today, whether or not you ever look at a single figure we report.
Executive summary
Research question: Across eligible U.S. pool-service operations, how can four recurring operational constraints — seasonal capacity, repeat-visit vs. first-visit resolution, truck-stock readiness, and technician documentation completeness — be defined and measured consistently enough that owners can compare their own operations against a common standard?
Eliminate missed appointments and dispatch delays.
Splshly ensures every pool service is scheduled, tracked, and completed efficiently.
- Unified scheduling dashboard
- Automated customer reminders
- Technician route optimization
No credit card required
Reporting period: The measurement framework is designed around a rolling 12-month operational window so seasonal swings are captured in full. Any figure published in a future refresh will state its exact window.
Geography: United States pool-service operations only. Regional climate differences (year-round Sun Belt routes vs. seasonal Northern markets) are treated as a segmentation variable, not averaged away.
Sample definition: Eligible records are de-identified, event-level job records from pool-service businesses — completed service visits, repairs, maintenance stops, follow-ups, cancellations, and reschedules — plus, where available, inventory and parts-request events tied to work orders.
What this data can establish: With consistently structured records, the framework can describe observed patterns — how often certain work types recur, how scheduled load compares to completed load by season, and which documentation artifacts tend to accompany resolved-on-first-visit jobs.
What this data cannot establish: It cannot prove that any tool, workflow, or platform causes better outcomes. It cannot represent every U.S. pool-service business. And it cannot be treated as an industry standard. These are descriptive and, at most, correlational observations from a non-random sample of businesses that happen to keep structured digital records — which is itself a selection bias worth naming out loud.
Methodology and data governance
This is the part most operational reports skip. It's also the part that makes the rest worth reading.
Unit of analysis
The base unit is the job event — a single scheduled or completed interaction with one pool at one address. Events roll up to the work order (an issue and its related follow-ups) and to the business (for company-size segmentation). Reporting always states which level a figure describes.
Eligible records
-
A job type (maintenance, repair, follow-up, inspection)
-
A completion status (completed, cancelled, rescheduled, no-access)
-
A timestamp for scheduled and actual service
-
An address or property identifier (de-identified before analysis)
Records missing any of these four fields are excluded from calculations that depend on the missing field, and the exclusion count is reported alongside the metric. Incomplete records are not silently dropped into an average.
De-identification
Before any analysis, personally identifiable information — customer names, exact addresses, phone numbers, account notes — is stripped or replaced with non-reversible identifiers. Property identifiers are hashed so repeat-visit matching can happen without exposing who or where. Aggregation thresholds apply: no segment is reported if it would represent fewer than a minimum cell size (5 businesses / sufficient job counts) to prevent re-identification.
Treatment of incomplete records
-
Field-level exclusion, not row-level deletion. A record missing a parts field is still usable for capacity analysis.
-
Reported denominators. Every metric shows how many records actually fed it.
-
No imputation of outcomes. Missing return-trip flags are never assumed to mean anything.
Core calculation formulas
| Metric | Formula |
|---|---|
| First-visit resolution rate | (Work orders resolved with no unplanned return within the follow-up window) ÷ (Total eligible work orders with a defined resolution) |
| Unplanned return-trip rate | (Work orders with ≥1 unplanned return within window) ÷ (Total eligible work orders) |
| Seasonal capacity utilization | (Completed job-hours in period) ÷ (Available crew job-hours in period) |
| Backlog / deferral rate | (Jobs requested but deferred to a later period) ÷ (Total jobs requested in period) |
| Documented stockout rate | (Work orders with a logged unavailable-part event) ÷ (Work orders requiring a part) |
| Documentation completeness | (Completed jobs with all required artifacts present) ÷ (Total completed jobs in scope) |
The follow-up window for return-trip matching is pre-specified at 14 days unless a business's own service cadence justifies a different disclosed window. This matters: choosing the window after seeing the data is how you manufacture a flattering fix rate.
Defining the terms before anyone quotes a number
Half the arguments about pool-service performance are really arguments about definitions. Below is the neutral language this report uses. Steal it for your own operation even if you never benchmark against anyone.
-
First-visit resolution A work order where the reported issue is resolved on the initial visit with no unplanned return required within the follow-up window. Planned staged work does not count against it.
-
Unplanned return trip A second (or later) visit for the same issue that was not scheduled at the time of the first visit — the tech came back because something wasn't finished, wasn't diagnosed, or wasn't available.
-
Planned follow-up A subsequent visit deliberately scheduled during the first visit (e.g., "ordered the pump, installing Thursday"). This is good operational behavior and must be separated from return trips, or your fix rate looks artificially bad.
-
Stockout A documented event where a required part or material was unavailable at the point of service. A return trip alone does not prove a stockout — the part event has to be logged. Inferring stockouts from return visits is one of the most common ways operational data misleads you.
-
Technician capacity Available productive crew hours in a period, net of drive time, PTO, and non-billable overhead — not raw headcount times eight.
-
Seasonal workload Requested and scheduled job volume within a defined calendar window, measured against capacity for the same window.
The single biggest measurement mistake: treating every second visit as a failure. When planned follow-ups and unplanned returns get lumped together, growing companies that legitimately stage bigger repair jobs look worse than sloppy shops that never book the follow-up at all. Separate the two or the number is worthless.
Operational-record profile (framework template)
Because this version is a methodology-first snapshot rather than a large-sample release, the table below shows the profile structure every published finding will use — sample size, size bands, geography, service mix, and observation window all disclosed on the same line as the number.
| Profile dimension | Categories tracked |
|---|---|
| Sample size | Number of businesses; number of job events; number of work orders (each stated per metric) |
| Company-size band | Solo/owner-operator; 2–5 techs; 6–15 techs; 16+ techs |
| Geographic coverage | Year-round (Sun Belt) vs. seasonal (Northern/transitional) markets |
| Service mix | Residential-only; commercial-only; mixed |
| Work type | Recurring maintenance; repair; inspection; follow-up |
| Observation period | Rolling 12-month window, with peak/shoulder/off-season sub-periods |
Invented counts are not published in this version. When a validated dataset meets the minimum viable thresholds described at the end, the categories above will carry real denominators — and only then.
Seasonal capacity: where the math quietly breaks
Capacity is the constraint owners feel first and measure last. The pattern is consistent across the operators we spoke with: nobody's short on demand in July. They're short on usable hours, and they usually don't know the gap until backlog is already visible to customers.
The trap is this: capacity utilization looks healthy at the annual level — a shop is "busy all year" — because off-season slack masks the peak-season crunch. Averaged across twelve months, utilization might read fine. Split it by sub-period and the peak window can push well past sustainable, while the shoulder season sits half-empty.
A realistic example of how this surfaces: A mixed residential/commercial operation running around 5 techs schedules based on last year's total volume. Their annual utilization pencils out. But from roughly mid-June through August, requested job-hours run maybe 20–30% above available crew hours. That overflow doesn't show up as lost revenue on a report — it shows up as deferred maintenance stops, rushed repairs, and the slow drip of "we couldn't get to you this week" that quietly erodes recurring accounts. By September everything looks normal again, so the root cause never gets diagnosed.
That's why this framework measures capacity by sub-period, never as a single annual figure. Specifically, it tracks:
-
Scheduled workload vs. completed workload per period (reveals slippage)
-
Deferred/backlog rate per period (reveals overflow)
-
Available crew job-hours net of drive time (reveals true, not theoretical, capacity)
The insight most owners miss: adding a truck in July doesn't help if the bottleneck is dispatch and route density, not headcount. Capacity is a system number — crew hours, drive time, route batching, and follow-up scheduling all feed it. Measuring only headcount hides the real constraint.
Repeat visits vs. first-visit resolution
This is the metric most likely to be misread, so the classification rules do the heavy lifting.
Every subsequent visit to a work order gets classified before it's counted:
-
Was the follow-up scheduled during the first visit? → Planned follow-up (not a failure)
-
Was it a new, unrelated issue? → New work order (excluded from the original's fix rate)
-
Was it an unplanned return for the same issue within the window? → Counted against first-visit resolution
"The pattern worth flagging:" in operations that don't distinguish these, repair-heavy work almost always shows a worse "fix rate" than maintenance-heavy work — not because the techs are worse, but because repairs legitimately involve more staged, parts-dependent visits. If you compare a repair-focused crew against a maintenance route using the same crude "any second visit = fail" metric, you'll punish the wrong people.
A defensible repeat-visit finding, once validated data supports it, would report the unplanned return-trip rate segmented by work type and season, each with its own denominator. It would also state plainly whether any relationship to a workflow is descriptive (we observed it) or correlational (it moves together) — never causal, because this design can't support a causal claim.
Truck-stock readiness
The rule that governs this entire section: a stockout must be a logged event, not an inference. If your only evidence that a part was missing is that the tech came back, you don't have stockout data — you have return-trip data, and the two get conflated constantly.
Valid truck-stock measurement needs three things tied together at the work-order level:
-
The parts requirement for the job (what the work actually needed)
-
The inventory/parts-request event (was it on the truck, requested, or unavailable)
-
The stockout definition (unavailable at point of service, logged as such)
Log parts events at the moment of diagnosis to avoid later ambiguity between stockouts and diagnosis issues.
Only when those three connect can you compute a documented stockout rate worth defending. Everything short of that is a guess.
Where operators go wrong: they stock trucks off gut feel and last season's memory, then blame "parts problems" for return trips that were actually diagnosis problems — a part that wasn't identified as needed until the tech was already onsite. Those are different failures with different fixes. One is a replenishment/PAR problem; the other is a documentation and diagnostic-capture problem. Lumping them together sends owners to buy more inventory when the real issue was information.
Technician documentation: the quiet lever
This is where the operational and the measurable intersect. The artifacts a tech captures on a visit — photos, water readings, equipment model/serial identifiers, notes, and customer-access instructions (gate codes, dog on premises, pump location) — are the raw material for resolving the next visit without a return.
The framework tracks documentation completeness as the share of completed jobs where all required artifacts for that job type are present. One important caveat: thorough documentation is associated with first-visit resolution. It cannot be claimed to cause it. A meticulous tech might both document well and fix well because they're simply a careful worker — the paperwork and the outcome share a cause. Honest reporting names that ambiguity instead of selling the correlation as proof.
Still, the operational logic stands on its own regardless of the statistics. A tech who can't find the gate code, doesn't have the pump model on file, and has no photo of last visit's corroded fitting is set up to fail before they leave the yard. The documentation isn't bureaucracy — it's the difference between a diagnosis and a guess.
The pattern across the operators we interviewed: the single artifact most often missing wasn't the complicated stuff. It was reliable customer-access information. Techs arriving to locked gates and unreachable customers burned real hours — capacity lost not to skill or parts, but to a blank field in the record.
Practitioner perspectives
Two pool-service operators reviewed the definitions and checklist in this report for practicality. Neither is presented as an endorsement of any product, and their input was solicited for operational relevance only. Both preferred to speak on an anonymized basis and are labeled accordingly; no attributable company identification is claimed.
Operator A — owner, mixed residential/commercial, seasonal Northern market (anonymized by request): Flagged that the biggest source of "false" return trips in his shop was staged repair work that his old system never separated from unplanned returns. Splitting the two, he noted, changed how he'd evaluate his techs — "half the guys I thought were sloppy were just the ones booking the follow-up honestly."
Operator B — operations manager, residential-focused, year-round Sun Belt market (anonymized by request): Emphasized that capacity problems in peak season were invisible on annual reports and only surfaced when reviewed by month. She also stressed the access-information point — that a meaningful share of lost productive hours traced back to missing gate codes and unconfirmed appointments rather than anything technically difficult.
These perspectives are qualitative context, not measured findings, and are labeled as such.
Operational decision guide
Use observable conditions in your own operation to figure out which problem you actually have. Most owners chase the wrong one.
A simple workflow can help you decide which failure mode fits your observed patterns.
-
Is the issue capacity, or is it coordination? - Look at
peak-period completed hours vs. available crew hours, and deferral rate by month. - If deferrals cluster in a narrow seasonal window while shoulder months sit slack → capacity planning / scheduling, not hiring. - If deferrals are spread evenly but drive time is high → routing and batching, not capacity.
-
Are your return trips a fix problem or a booking problem? - Look at
unplanned returns vs. planned follow-ups, separated. - If "returns" are mostly planned staged work → your data is lying to you; fix the classification first. - If unplanned returns concentrate in specific repair types → diagnostic capture and documentation.
-
Is it really parts, or is it information? - Look at
logged stockout events vs. return trips with no logged parts event. - Many returns, few logged stockouts → on-site diagnosis / parts identification, not inventory. - Frequent logged stockouts on predictable parts → replenishment / PAR levels.
-
Are your techs set up to resolve on the first visit? - Look at
documentation completeness, especially customer-access fields. - High missing-access rate → intake and record hygiene, before anything technical. - Missing equipment identifiers on repeat repair sites → knowledge capture / job-history standardization.
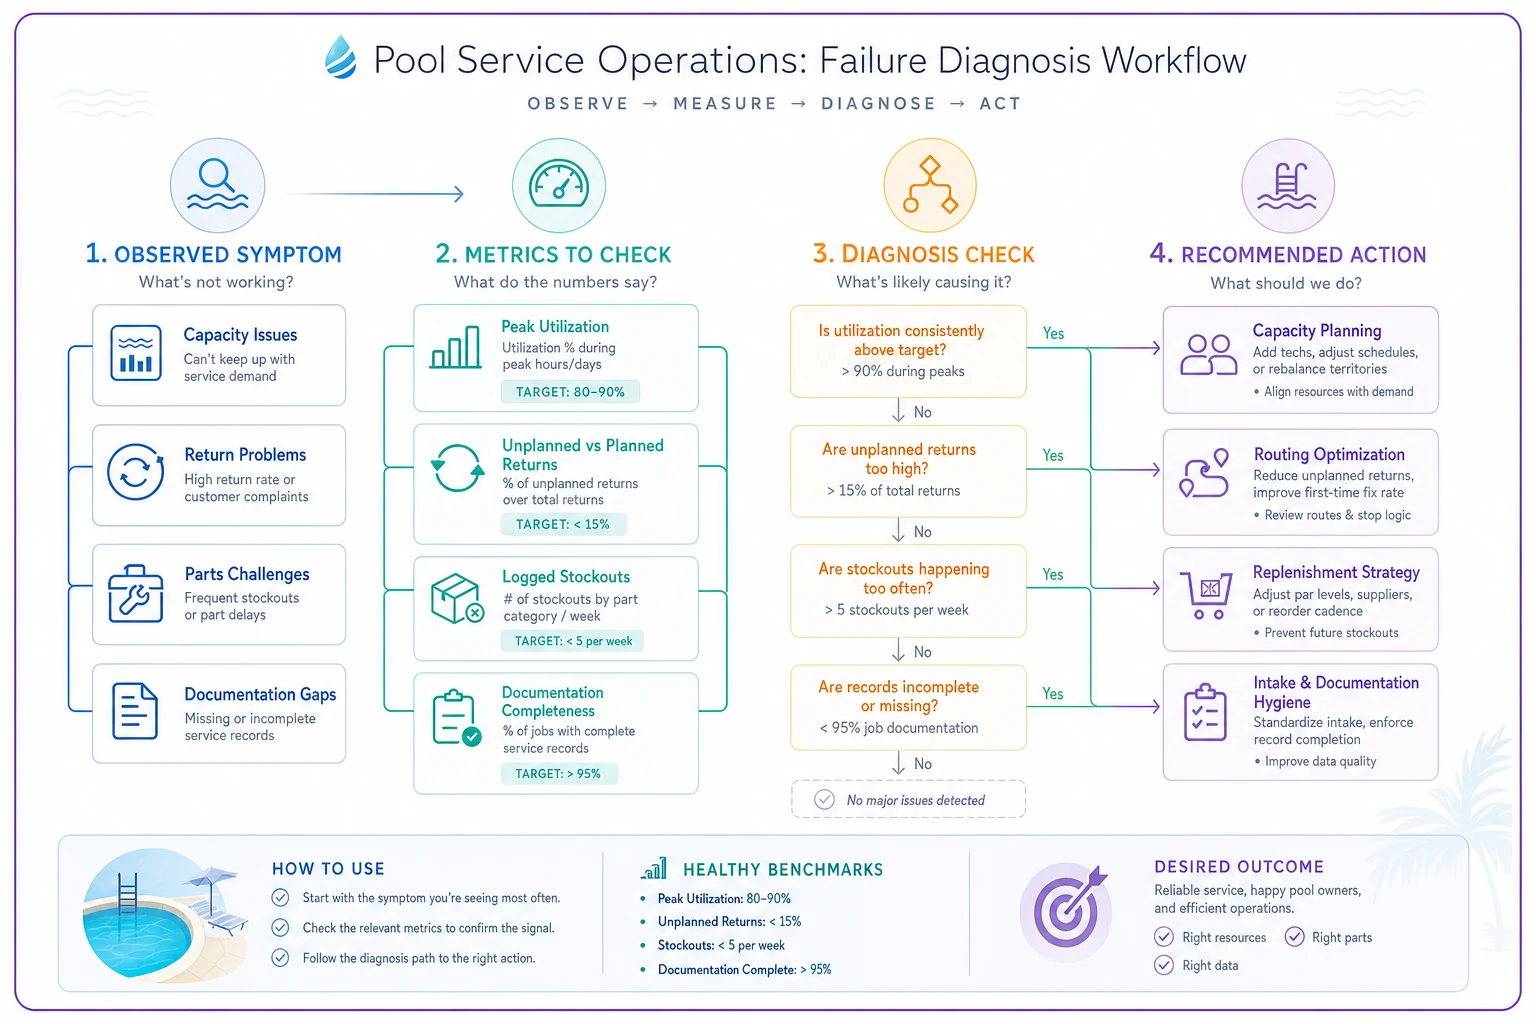
These four failure modes feel identical from the owner's chair. They all look like "we're too busy and things fall through." Only the defined measures tell them apart — and the fix for each is completely different.
Seasonal-readiness worksheet
This is operational guidance derived from the measures above. It is not a safety, chemical-treatment, or regulatory standard, and it does not cover chemical handling or incident response. Copy it directly into your own doc or spreadsheet — no download form, no sales call.
Capacity review
-
- [ ] Peak-window requested job-hours calculated (not annual average)
-
- [ ] Available crew job-hours computed net of drive time and PTO
-
- [ ] Peak-period utilization = completed ÷ available, reviewed by month
-
- [ ] Deferral/backlog rate tracked per sub-period
-
- [ ] Shoulder-season slack identified for pull-forward work
Recurring-workload review
-
- [ ] Recurring maintenance stops mapped against peak capacity
-
- [ ] Recurring accounts flagged for at-risk service windows
-
- [ ] Route density reviewed before adding headcount
Repair-return classification
-
- [ ] Every second visit classified
planned follow-up / new issue / unplanned return
-
- [ ] 14-day (or disclosed) follow-up window set before analysis
-
- [ ] Unplanned return rate segmented by work type
Truck-stock review
-
- [ ] Stockouts logged as events, not inferred from return trips
-
- [ ] Parts requirement captured at work-order level
-
- [ ] PAR levels reviewed against logged stockouts, not memory
-
- [ ] Return trips with no logged part event flagged as diagnosis issues
Technician-documentation review
-
- [ ] Required artifacts defined per job type
-
- [ ] Customer-access fields (gate code, access notes) verified before dispatch
-
- [ ] Equipment model/serial captured at repair sites
-
- [ ] Photo + readings + notes completeness spot-checked
Every item above traces to a defined metric or a practitioner-flagged pattern in this report.
A short, realistic scenario
Consider a residential-focused shop running around 4 techs in a seasonal market. Going into summer they feel maxed out and start pricing a fifth truck. Before hiring, they run the four decision-guide checks against a rolling year of job records.
-
Peak-window utilization is genuinely over capacity for about six weeks.
-
The apparent "high return-trip rate" turns out to be mostly planned staged repairs miscounted as failures.
-
Once separated, unplanned returns are modest and cluster around two repair types where the tech routinely arrives without a confirmed part.
-
A meaningful slice of lost hours traces to locked gates and unconfirmed appointments — capacity leaking through a blank field in the record.
The outcome isn't a fifth truck. It's a defined follow-up window that fixes the reporting, a diagnosis-capture step for two repair types, and mandatory access-info verification before dispatch. The six-week crunch eases enough that the hire gets deferred a season.
No revenue miracle — just a few hours a week recovered per tech and a clearer picture of what was actually breaking. The number that mattered most wasn't a percentage; it was learning the problem wasn't the one they were about to spend money on.
When this framework helps — and when it doesn't
When it makes sense: You already keep structured, event-level job records (or could within a season), you're making a real resourcing decision, and you're tired of guessing whether the problem is people, parts, or process.
When it's a bad idea: If your records are mostly paper or free-text with no consistent job-type and status fields, don't force these metrics onto them. You'll compute confident numbers from unreliable inputs, which is worse than no number at all. Fix record hygiene first.
Who should not bother yet: Brand-new solo operators with a handful of accounts. At that scale you can see every problem directly; formal benchmarking is overhead you don't need until coordinating across techs becomes the actual constraint.
Where operational software earns its place in all of this is unglamorous: it's mostly about capturing these fields consistently — structured job types, logged parts events, separated follow-up flags, enforced access fields — so the measures above are computable at all. Platforms like Splshly exist to make that capture and roll-up routine rather than a manual export project. But the framework itself is tool-agnostic. You can run every calculation in this report against any system that stores the fields honestly, and that's really the point.
Limitations, conflict-of-interest disclosure, and sources
Conflict of interest and data source. This report is produced and funded by Splshly, a pool-service operations software provider. Any dataset referenced would be drawn from businesses using Splshly and is therefore not a random or representative sample of the U.S. pool-service market — it reflects operations that already keep structured digital records, which skews toward more process-mature businesses. Because Splshly produced this analysis, supplied any underlying data, and selected the framework, this report is not independent. It should not be described as such.
No causal claims. Nothing here should be read as evidence that Splshly, or any tool or workflow, causes higher first-visit resolution, lower costs, fewer truck rolls, or improved profitability. Associations described are, at most, correlational, and are labeled where they appear.
Not a standard. None of these metrics is an industry standard or established benchmark. They are proposed, defined measures with disclosed origins and limits, offered so operators can measure their own work consistently.
Review status. The metric definitions and checklist were reviewed for practicality by two pool-service practitioners (anonymized above). This version has not undergone independent statistical or research-methods review; no such review should be inferred. Any future release that publishes benchmark percentages, segment differences, or trend claims will state whether that review has occurred, and by whom. No chemical-handling, safety, legal, labor, or tax guidance is provided, as those fall outside this report's scope and require qualified review.
Minimum viable data standard. No performance percentages are published in this version because the validated dataset required to support reproducible, denominator-backed figures across the defined measures is not yet established. Consistent with the report's own standard, we publish the methodology, definitions, decision framework, and worksheet now — and will publish figures only when a disclosed, sufficient sample supports them.
Sources for non-original context. This report makes no external factual claims requiring third-party citation; all operational definitions, formulas, and framework elements are original to this document. Where a future refresh cites external context (e.g., seasonality or workforce data), each source will be named with its publication date or version. Practitioner input is used with permission and retained on record.
Version 1.0 — June 2026. Methodology and definitions on this page are freely reproducible for operational use with attribution. Questions about the metric definitions or calculation guide can be directed to the Splshly Operations Research team.
Ready to elevate your pool service business?
Join hundreds of pool service professionals using Splshly to save time, optimize routes, and enhance customer satisfaction.