



Disclosure and what this document is (read this first). This framework was produced and funded by Splshly, a company that builds operational software for field-service businesses. It is a measurement methodology — a set of definitions, classification rules, worksheets, and decision trees — not an independent Australian industry benchmark, a representative survey, or a regulatory guide. It contains no Australian industry averages, no sample-based performance rates, and no outcome claims. Where this document makes any Australia-specific statement about seasons, standards, or safety, it links directly to a primary source. Where we could not obtain qualified Australian review on a compliance-sensitive topic, we deliberately left prescriptive advice out rather than guess.
That's the honest version. Now onto why the way most pool-service businesses measure their own performance is quietly broken — and how to fix the measurement before you even think about the number.
The real problem isn't the metric. It's that nobody agrees what the metric means.
Walk into three pool-service businesses and ask each one for their "first-time fix rate." You'll get three numbers that look comparable and aren't.
One counts a job as "fixed first time" if the tech didn't have to physically return. Another counts it only if the customer didn't call back within a week. A third quietly excludes any job where a part was ordered — because "that's not really a failed visit, that's just how ordering works." Same words. Completely different denominators. The numbers aren't measuring the same thing, which means comparing them tells you nothing.
-
Owners make staffing and route decisions on numbers that drift as the business grows and new dispatchers "interpret" categories differently.
-
Return visits get hidden inside "planned follow-ups," so the business never sees its true rework load.
-
Stock-related delays get blamed on technicians, because nobody separated "didn't have the part" from "didn't diagnose it correctly."
A good framework doesn't make your numbers better. It makes them honest and stable — same definition this quarter as last quarter, same definition on Tech A's jobs as Tech B's. That's the whole game. Everything below is built to make the counting rules explicit enough that two different people would classify the same job the same way.
The metric definitions table
Every metric here states four things that most internal dashboards leave vague: the denominator (what you're dividing by), the reporting period, the return-visit window (how long you watch for a comeback), and the exclusions (what you deliberately don't count). If you only take one thing from this document, take the habit of writing these four things next to every number you report.
Eliminate missed appointments and dispatch delays.
Splshly ensures every pool service is scheduled, tracked, and completed efficiently.
- Unified scheduling dashboard
- Automated customer reminders
- Technician route optimization
No credit card required
| Metric | Definition (numerator / denominator) | Reporting period | Return-visit window | Key exclusions |
|---|---|---|---|---|
| First-visit resolution (FVR) | Jobs resolved on the first attendance ÷ total eligible jobs attended | Weekly; roll up to monthly | A job only counts as "resolved" if no unplanned return occurs within the chosen window (see below) | Planned staged work; jobs cancelled on arrival; access-denied jobs |
| Planned staged work | Jobs intentionally scheduled across two or more visits ÷ total jobs attended | Weekly | N/A — these are expected to recur by design | Emergency callbacks; warranty rework |
| Unplanned return visit | Return attendances caused by an unresolved or recurring issue ÷ total eligible jobs attended | Weekly; monthly trend internally | Default 14 days from original attendance (you choose; just state it) | Planned staged follow-ups; new/unrelated issues at same site |
| Schedule spillover | Scheduled jobs not completed on their scheduled day ÷ total scheduled jobs | Daily, summed weekly | N/A | Customer-initiated reschedules; weather closures (tag separately) |
| Documented stockout | Jobs delayed or returned because a required part/chemical wasn't on the truck or in stock ÷ total jobs requiring a part | Weekly | Tie to the same return window as unplanned returns | Parts that were never expected to be truck-stock (special-order items) |
| Capacity utilisation | Productive on-site + travel hours ÷ available scheduled technician hours | Weekly | N/A | Approved leave; vehicle-down days; training days (tag separately) |
| Documentation completeness | Jobs with all required fields/photos/readings captured ÷ total jobs attended | Weekly | N/A | None — every attended job is eligible |
First-visit resolution — full specification. Denominator: total eligible jobs attended in the reporting week. Reporting period: weekly, rolled to monthly. Return-visit window: a job is only credited as "resolved first visit" if no unplanned return happens within your stated window (14 days is a sensible default — but state whatever you pick). Treatment of planned staged work: excluded from both numerator and denominator. If you quoted a two-visit resurface/filter-change job on purpose, it should never count against your FVR.
Unplanned return visit — full specification. Denominator: total eligible jobs attended. Reporting period: weekly for operations, monthly for trend. Return-visit window: the same window you chose for FVR — don't use two different clocks. Treatment of planned staged work: excluded. The entire point of this metric is to isolate rework you didn't plan for. If planned follow-ups leak in, the number becomes meaningless and usually makes your team look worse than they are.
Classification rules: the decision tree that keeps two people counting the same way
The failure mode here is subtle. A dispatcher sees a second visit to the same pool and has to decide: planned or unplanned? Stock-related or not? Done or just "documented"? If that decision lives in someone's head, your data drifts the moment that person goes on leave.
Below is the classification logic in plain text. Every branch ends in an observable outcome — something you can point to in the job record, not a judgment call.
Decision tree — classifying a return or delay
-
Was a second (or later) visit to this site scheduled at the time the first job was booked or closed? - Yes → it's a Planned staged follow-up. (Observable test: a future visit was on the schedule or in the job notes before the first visit ended.) Stop here. - No → go to 2.
-
Is the new visit for the same unresolved or recurring issue as the original attendance, within the return-visit window? - No, it's a new/unrelated issue → classify as a new job, not a return. Stop here. - Yes, same issue, within window → it's an Unplanned return. Continue to 3 to find the cause.
-
Could the first visit have resolved the issue if the required part or chemical had been on the truck/in stock? - Yes → Stock-related delay. (Observable test: the job record shows a required item was unavailable, back-ordered, or not carried.) Log it as a documented stockout and an unplanned return. - No → Non-stock-related delay (misdiagnosis, access, equipment failure after the visit, time constraint, etc.). Tag the actual cause. This is still an unplanned return, but it is not a stockout.
-
Was the job physically completed AND are all required fields, readings, and photos captured? - Completed work, documentation incomplete → status is "Work done, documentation incomplete." It is not yet "documentation-complete." - Completed work, documentation complete → Documentation-complete job.
The "work done vs documentation-complete" split is the one most owners skip, and it's the one that bites hardest as you grow. A three-truck business can get away with chasing missing readings by memory. A ten-truck business cannot. When documentation completeness isn't its own tracked status, disputes, warranty claims, and water-chemistry history all degrade at exactly the moment you have the most volume to protect.
A seasonal-readiness workflow
Australian pool-service demand is strongly seasonal, and the Australian summer falls across December, January and February (per the Australian Bureau of Meteorology's definition of the seasons) — the inverse of the Northern Hemisphere pattern that most imported operational templates assume. That single fact breaks a lot of borrowed playbooks: a US-authored "get ready for summer in April" calendar is pointing you at completely the wrong months.
> Source: Australian Bureau of Meteorology, "Australian seasons" — http://www.bom.gov.au/climate/glossary/seasons.shtml (accessed 11 June 2025). The BoM defines summer as December–February for climate purposes.
Everything else in this workflow is operational method rather than a country-specific claim, so it applies regardless of where you operate.
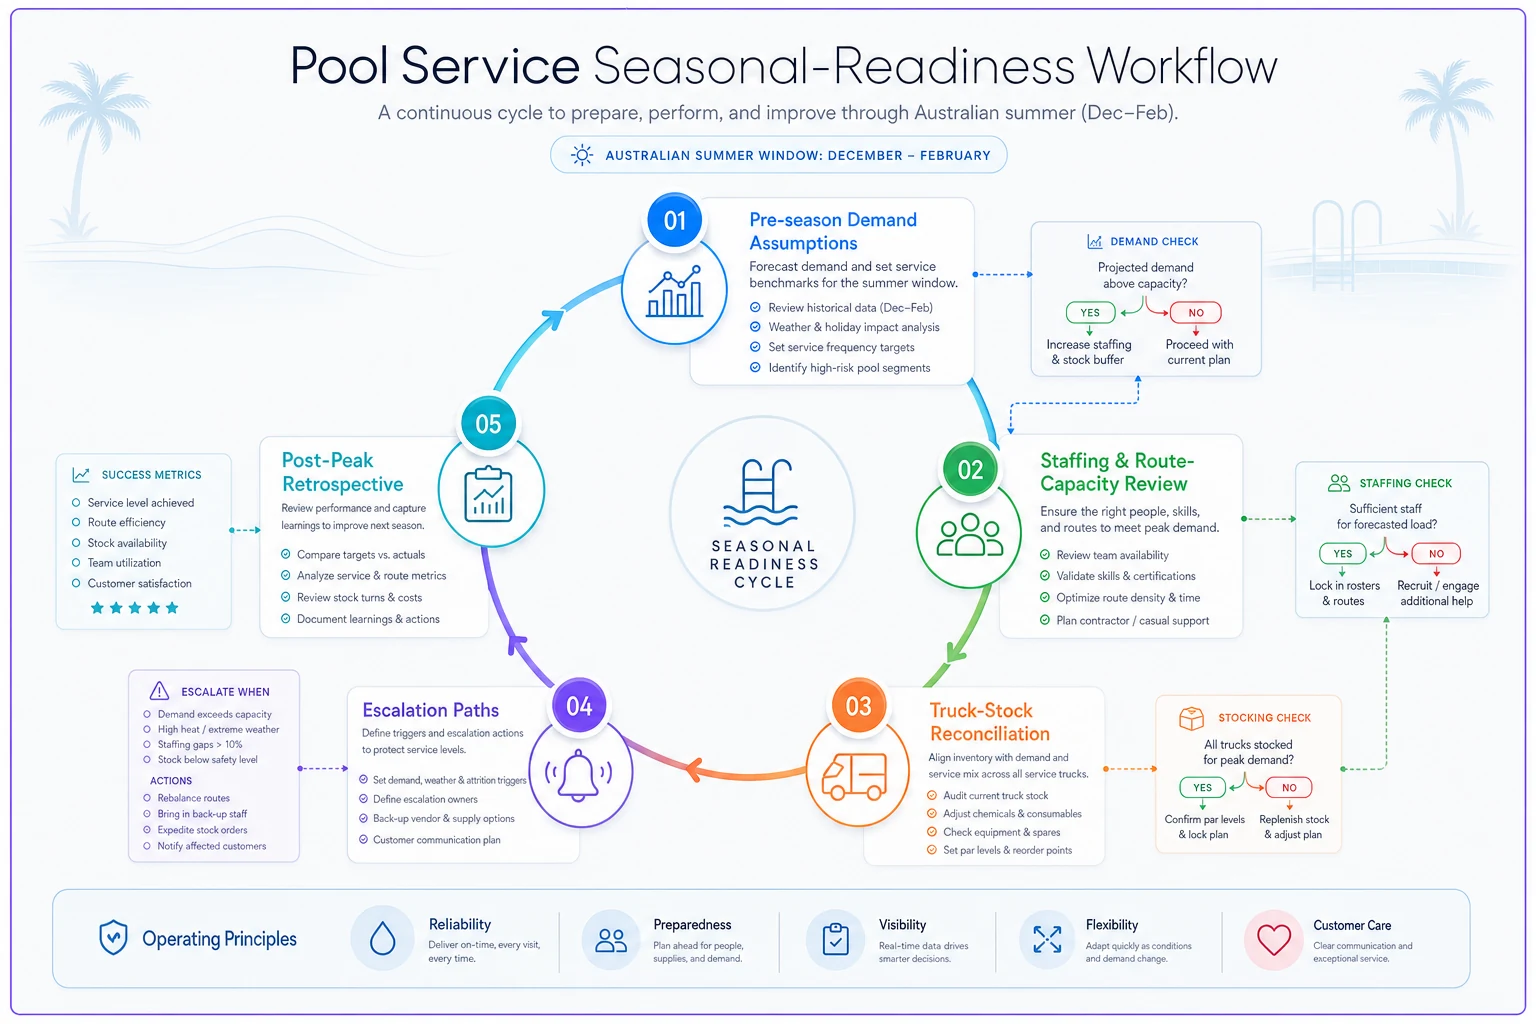
The five-stage readiness cycle
-
Pre-season demand assumptions (write them down). Before peak, state your assumptions explicitly: expected booking volume vs last cycle, expected mix of recurring vs one-off vs emergency, and the single biggest demand driver you're betting on. Writing assumptions down is what lets you actually learn in the post-peak review — you can't check an assumption you never recorded.
-
Staffing and route-capacity review. Convert your demand assumption into required technician-hours, then compare against available hours (not headcount — hours, net of leave and training). The gap is your hiring/overtime/subcontract decision, made early enough to act on.
-
Truck-stock reconciliation. Reconcile what's actually on each truck against your peak-season stocking plan. The goal is to drive down documented stockouts before they happen — the single most controllable driver of unplanned returns in most route businesses.
-
Escalation paths. Decide in advance who gets called when a truck goes down, a key part back-orders, or a tech calls in sick during peak. Escalation invented in the moment is slow and expensive. Written down, it's a phone call.
-
Post-peak retrospective. After peak, compare actuals to the assumptions you wrote in stage 1. Which metric moved? Were stockouts concentrated on a few SKUs? Did spillover cluster on particular days or routes? This is where next year's plan actually gets built.
Here's a simple visual of the five-stage readiness cycle you can share with your team.
The pattern across route-based field businesses is consistent: teams that handle peak well aren't the ones who work hardest during it — they're the ones who made their decisions in the shoulder period, while there was still time to change the plan.
Two clearly labelled hypothetical examples
> These are illustrative, hypothetical calculations created to demonstrate the method. The numbers are invented for teaching purposes. They are NOT observed business results, survey findings, market averages, or benchmarks of any kind.
Hypothetical Example A — "Coastline Pools" (illustrative)
A fictional three-truck operator attends about 220 jobs in a peak week.
-
Planned staged jobs (excluded from FVR)
~25
-
Eligible jobs
220 − 25 = 195
-
Unplanned returns within a 14-day window
18 - Of those, flagged as stock-related: 11 - Non-stock (misdiagnosis/access/other): 7
Illustrative FVR = (195 − 18) ÷ 195 ≈ 0.91, or about 91% (hypothetical). Illustrative unplanned-return rate = 18 ÷ 195 ≈ 9.2% (hypothetical). Illustrative documented-stockout contribution = 11 ÷ 195 ≈ 5.6% (hypothetical).
What the method shows: more than half of this fictional operator's unplanned returns trace to stock, not diagnosis. The corrective action points at the truck-stock plan, not at retraining techs.
Hypothetical Example B — same business, different assumptions (illustrative)
Now imagine the same fictional week, but the operator uses a 7-day return window instead of 14, and counts planned staged jobs in the denominator (a common mistake).
-
Denominator now includes staged work
220
-
Returns captured in the shorter 7-day window
12 (six later returns fall outside the window)
Illustrative FVR = (220 − 12) ÷ 220 ≈ 0.945, or about 94.5% (hypothetical). Same business. Same week. The second number looks noticeably better — purely because the definitions changed. Nothing operational improved. The clock and the denominator moved. This is why every reported number needs its four parameters (denominator, period, window, exclusions) attached before anyone draws a conclusion from it.
Manager worksheet — weekly and peak-season review
Copy this into a spreadsheet or print it. Every field exists to force the "four parameters" discipline and a named owner for corrective action. This worksheet uses the same definitions and classifications as the main framework above.
Header (fill once per review)
-
Business / depot
-
Reporting period (dates)
-
Return-visit window used (e.g. 14 days)
-
Source system(s) for the data
-
Prepared by / review owner
-
Review cadence
☐ Weekly ☐ Peak-season (more frequent) ☐ Post-peak retrospective
Metric rows
| Metric | Numerator | Denominator | Exclusions applied | This period's value | Source system | Corrective-action owner | Due date |
|---|---|---|---|---|---|---|---|
| First-visit resolution | Planned staged work; cancels on arrival | ||||||
| Planned staged work | |||||||
| Unplanned return visit | Planned follow-ups; new issues | ||||||
| Schedule spillover | Customer reschedules; weather | ||||||
| Documented stockout | Special-order items | ||||||
| Capacity utilisation | Leave; training; vehicle-down | ||||||
| Documentation completeness | None |
Seasonal-readiness block (use in the shoulder period and at post-peak review)
-
Demand assumption (volume & mix, written out)
-
Required technician-hours vs available hours (gap)
-
Route-capacity check — routes at/over capacity
-
Staffing plan — hire / overtime / subcontract decision & owner
-
Truck-stock reconciliation — SKUs short vs peak plan
-
Documentation review — % jobs documentation-complete last period
-
Escalation paths confirmed (truck down / part back-order / sick tech) — owner
-
Post-peak retrospective date & owner
Assign a single named corrective-action owner and a due date for each row so nothing sits unresolved in the spreadsheet.
Keeping all of this in one place — with a named owner and due date on every corrective action — is where operational software (including platforms like Splshly) can reduce manual reconciliation and keep definitions consistent as you scale. That's a workflow convenience, not a performance claim: the software doesn't make your FVR go up; it makes your FVR mean the same thing every week, which is the precondition for improving it.
Australian-context notes (primary sources only)
We're deliberately conservative here. The only Australia-specific factual claim this document relies on is the definition of the summer season, cited above. Topics like pool suction-outlet safety, chemical handling, and electrical work are genuinely compliance-sensitive and jurisdiction-specific. This framework does not give advice on those subjects because we did not obtain qualified Australian compliance review to do so responsibly.
-
Seasons / climate timing Australian Bureau of Meteorology — http://www.bom.gov.au/climate/glossary/seasons.shtml (accessed 11 June 2025).
-
Standards (identification only, not conformance advice) Standards Australia — https://www.standards.org.au/ (accessed 11 June 2025). Standards in areas such as pool safety and water circulation exist and are updated periodically; identify the current, applicable standard rather than relying on any summary.
-
Work health and safety duties Safe Work Australia — https://www.safeworkaustralia.gov.au/ (accessed 11 June 2025). WHS obligations vary by state and territory regulator; confirm which regulator applies to you.
Nothing above should be read as legal, engineering, chemical-safety, electrical, or standards-conformance advice. It's a pointer to where the authoritative material lives.
When this framework helps — and when it doesn't
When it makes sense. You run a route-based residential and/or commercial pool-service operation, you have more than one person classifying jobs, and your internal numbers have started to feel unstable or arguable. The framework's value is consistency over time and across people — which is exactly what you need before making staffing, stocking, or pricing decisions off the data.
When it's a bad idea to over-invest. If you're a solo operator doing 20 jobs a week and you already know every customer and every pool by memory, formal classification trees are overhead you don't need yet. Capture the raw data cleanly, but don't build the full apparatus until a second or third tech makes "what counts as a return?" an actual question.
-
If you're a solo operator doing 20 jobs a week and you already know every customer and every pool by memory, formal classification trees are overhead you don't need yet.
-
Capture the raw data cleanly, but don't build the full apparatus until a second or third tech makes "what counts as a return?" an actual question.
Who should NOT treat this as a benchmark. Anyone tempted to take Example A's illustrative "91%" and present it to staff, customers, or an investor as a target or an industry norm. It isn't. It's a teaching number. Your real numbers only become meaningful against your own prior periods, measured the same way.
A short, realistic scenario
Consider a fictional four-truck operator heading into their first properly busy summer after a growth year. Before adopting consistent definitions, their "first-time fix" lived in a dispatcher's spreadsheet and hovered somewhere "in the high 80s" — a number nobody could reproduce because planned follow-ups were sometimes in the denominator and sometimes not.
After separating planned staged work, applying a single 14-day return window, and splitting stock-related from non-stock returns, two things happened. First, the headline number dropped slightly — which felt bad for about a week — because the hidden rework was finally visible. Second, and more usefully, the split revealed that a large share of unplanned returns clustered around a handful of back-ordered parts. The corrective action wasn't "retrain the techs." It was "fix the peak-season stocking plan for five SKUs." The following shoulder period, that cluster was the first thing reviewed.
The point isn't the numbers — they're illustrative. It's the pattern: honest definitions often make your numbers look worse at first, and that's exactly when they start being useful.
Limitations and how to interpret results (please don't skip this)
Consistent measurement supports better internal decision-making. It does not do any of the following:
-
It does not establish causation. A change in your FVR after adopting a new stocking plan is correlation, not proof. Too many other things move at once.
-
It does not establish legal or safety compliance. Nothing here certifies that your operation meets any Australian standard, WHS duty, or regulatory obligation. Those are matters for the primary sources above and qualified professionals.
-
It is not cross-company comparable. Two businesses' numbers can only be compared if their definitions, reporting periods, return-visit windows, exclusions, work mix, and data quality are all aligned — which, in practice, they almost never are. Comparing a 14-day-window FVR to a 7-day-window FVR (see Example B) is comparing nothing.
-
It is not a benchmark. This document contains no Australian industry averages, sample sizes, response rates, or trend data, and none of its illustrative figures should ever be quoted as such.
If you want to compare across depots within your own business, you can — but only if you lock the definitions across all depots first. The moment one depot "interprets" a category differently, the comparison is dead.
Methodology, contributor, reviewer, and conflict-disclosure note
What this framework measures: operational consistency of seven defined metrics (FVR, planned staged work, unplanned return visits, schedule spillover, documented stockouts, capacity utilisation, documentation completeness), using explicit denominators, reporting periods, return-visit windows, and exclusions.
What it does not measure: profitability, customer satisfaction, safety compliance, standards conformance, technician quality in isolation, or any outcome causally attributable to any software product.
Classification logic: every return/delay is resolved through the decision tree to an observable outcome, so that two reviewers using the same job record should reach the same classification.
Data-quality limitations: results are only as good as the job records behind them. Missing readings, inconsistent tagging, and un-reconciled truck stock all degrade the metrics. The documentation-completeness metric exists specifically to make that degradation visible.
Author: Prepared by the Splshly operations-methodology team. Splshly builds operational software for field-service businesses; this role is disclosed so readers can weigh the source. The framework is deliberately written so it can be used with pen, paper, and a spreadsheet — no software required.
Australian reviewer status (transparent): At the time of publication, this brief has not completed a documented review by a named Australian pool-service operator, educator, association representative, or standards specialist. Because of that, we have removed or withheld all prescriptive Australian compliance, suction-safety, chemical-handling, and electrical guidance, and limited Australia-specific claims to the single, primary-sourced seasonal definition above. If and when a named Australian practitioner reviews the localised operational recommendations, this note will be updated to identify the reviewer, their organisation, their relevant experience, and the specific scope of what they reviewed. We would rather say "not yet reviewed" than imply validation that hasn't happened.
Conflict-of-interest disclosure: Splshly produced and funded this framework. Splshly sells operational software. This document makes no claim that Splshly software improves first-visit resolution, reduces stockouts, improves capacity, improves safety, or lowers cost. Any such claim would require controlled evidence this document does not have.
Publication date: 11 June 2025. Version: 1.0. Scheduled review date: 11 June 2026 (or earlier if a named Australian reviewer is secured).
Source list
Primary sources cited below:
-
Australian Bureau of Meteorology — "Australian seasons" (season definitions, summer = Dec–Feb): http://www.bom.gov.au/climate/glossary/seasons.shtml — accessed 11 June 2025.
-
Standards Australia (standards identification only)
https://www.standards.org.au/ — accessed 11 June 2025.
-
Safe Work Australia (WHS duties overview; state/territory regulators apply)
https://www.safeworkaustralia.gov.au/ — accessed 11 June 2025.
These are the primary links referenced for season timing, standards identification, and WHS guidance; verify currentness before relying on them for compliance.
Editor-facing feature adaptation outline
For any trade editor considering a feature built around this methodology. This outline is offered as a non-promotional starting point. It requests nothing, promises nothing, and conditions nothing on attribution or links — any attribution, author bio, or outbound link is entirely at editorial discretion.
Working angle: "How pool-service businesses can define and measure capacity, rework, and stock delays — without borrowing numbers that don't mean anything."
-
The comparability trap — why two operators' "first-time fix rates" usually can't be compared (the four parameters: denominator, period, return-visit window, exclusions).
-
Planned vs unplanned returns — the single classification distinction that changes the whole picture, with the decision tree reproduced or redrawn.
-
Stock-related vs other causes — isolating the most controllable driver of rework ahead of peak.
-
Seasonal readiness, Australian calendar — anchoring preparation to the Dec–Feb summer (BoM-sourced) rather than imported Northern-Hemisphere timelines.
-
A reusable worksheet — the weekly/peak-season review grid, which readers can rebuild for their own operation.
-
Honest limitations — why consistent internal measurement is valuable even though it isn't a benchmark or a compliance test.
Suggested caveats an editor would want retained: the hypothetical nature of all figures; the explicit statement that this is a Splshly-produced methodology, not an industry benchmark; and the primary-source link for any Australia-specific claim actually published.
If a feature would benefit from Australian practitioner commentary, that review has not yet been secured as of this version — and this document should not be presented as carrying it until it has.
This is a Splshly-produced operational measurement methodology, version 1.0, dated 11 June 2025. It is not an independent Australian industry benchmark, survey, or regulatory guide. Use it to make your own numbers honest and stable — then interpret them carefully, against your own history, with the limitations above firmly in mind.
Ready to elevate your pool service business?
Join hundreds of pool service professionals using Splshly to save time, optimize routes, and enhance customer satisfaction.